/
 Competition Statistics Discovery Grants DG and Research Tools and Instruments RTI Program  Competition Statistics Discovery Grants DG and Research Tools and Instruments RTI Program

Competition Statistics Discovery Grants DG and Research Tools and Instruments RTI Program - PDF document

alexa-scheidler
alexa-scheidler . @alexa-scheidler
Follow
566 views
Uploaded On 2014-11-11

Competition Statistics Discovery Grants DG and Research Tools and Instruments RTI Program - PPT Presentation

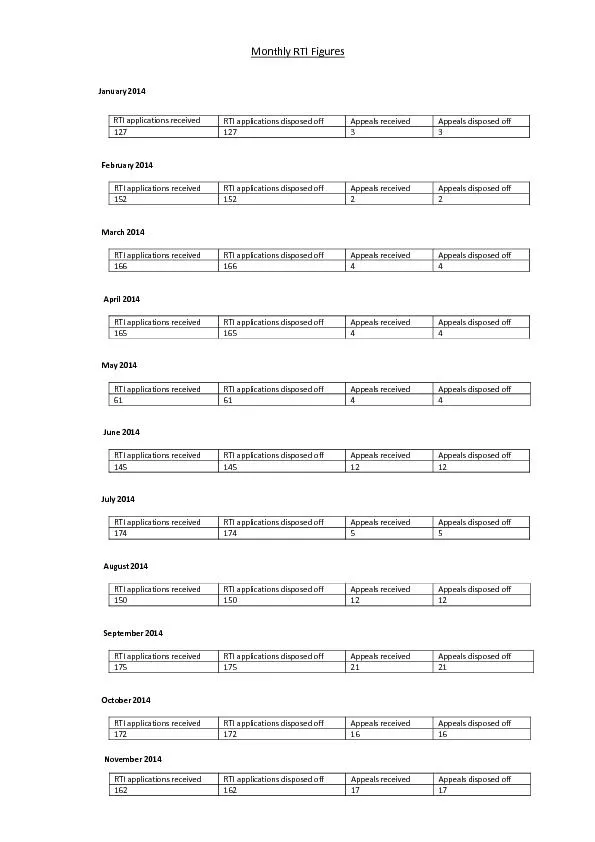
SECTION 1 FISCAL YEAR STATISTICS Figure 1 Expenditures in the Discov ery Grants Program Elements 2005 06 to 2014 15 Figure 2 Number of Grants Funded through Individual and Team Discovery Grants including those in Subatomic Physics and Subatomic ID: 10125

SECTION FISCAL YEAR

Share:

Link:

Embed:

Download Presentation from below link

Download Pdf The PPT/PDF document " Competition Statistics Discovery Grants..." is the property of its rightful owner. Permission is granted to download and print the materials on this web site for personal, non-commercial use only, and to display it on your personal computer provided you do not modify the materials and that you retain all copyright notices contained in the materials. By downloading content from our website, you accept the terms of this agreement.


Presentation Transcript

2014 Competition StatisticsDiscovery Grants(DG)and ResearchTools and Instruments(RTI)ProgramThis report includes tables and figures that providesummary information on the 2014Discovery Grants and Research Tool and Instruments ompetition 2 Figure 11 Discovery Grant Success Rate and Average Awarded Amount by Career Stage and Gender, 201114 CompetitionsFigure 12 Discovery Grant Success Rate and Average Grant by Applicant Status and Gender, 201114 CompetitionsFigure 13Discovery Grant Success Rate by Gender and Evaluation Group, 201114 CompetitioSECTION 5 RESEARCH TOOLS AND INSTRUMENTSTable 9 Overall Comparative Statistics, 20122014 Research Tools and Instruments Competitions 3 SECTION 1 FISCAL YEARSTATISTICSThis section presentdata on a fiscal year basis and is inclusive of ongoing instalments.Figure 1Expenditures in the Discovery Grants Program Elements, *Projected Expenditures for 2014Figure 2 Number of GrantsFunded through IndividualTeam Discovery Grants (including those in Subatomic Physics)and Subatomic Physics Projectsto *Projected Numbers of Grants for 4 Figure Average Grant for IndividualTeam Discovery Grants (including those in Subatomic Physics)and Subatomic Physics Projectsto rojecteAverage for 2014 5 SECTION 2COMPETITION STATISTICSThe total awarded amountforthe 201DG competition was millionThe number of DG applications in 201wasGoing into the competition, there were 668renewal applicants who held grants of, on average, 34,450; after the competition, there are nded researchersat an average grant level of $33,NSERC continued to put a strong emphasis on giving early career researchers(ECR)chanceto demonstrate their potential and exceeded the minimum target success rate of percent recommended in the International Revi of the Program.In Budget2011, NSERCwas allocated additional funding "to support outstanding research in the natural sciences and engineering fields, such as the Strategy for Partnerships and Innovation(SPI)." NSERCis devoting half of this moneyto enhance the Dof in the form of supplements to their grants. hese supplementsof a value of up to $5,000 per yearare included in the awarded amountreflected in the following statistics Table 1Overall Comparative Statistics Discovery Grants Competition Data 1 Success Rate Average Grant ($) Early Career Researchers (ECR) 66% $26,999 Established Researchers (ER) Renewing their grant (ER - R) 80% $36,550 Not Holding a Grant 2 (ER - NHG) 37% $28,463 1. Includes Discover y and Subatomic Physics (Individual and Team) Grants, but excludes the Subatomic Physics Projects. It cannot therefore be compared with data presented in Figure 3. 2. Includes returning established unfunded applicants and experienced researchers submitting a first application 6 Figure Distribution of Grant Levels to Successful ApplicantsCompetitionFigure Change in Grant LevelCompetitiona) All Established Researchers b) Established Researchers First Renewal 7 Figure Percentage Change in Grant Level for Established Researchers Renewing a Grant, CompetitionFigure 7Success Rateby Category of Individual ApplicantsCompetition YearOnly includes Discovery Grant Individual 8 Table 2Number of Applications and Awardsby Category of Applicants Competition Year Number of Applications 1 Number of Awards 1 ECR ER-R ER - NHG Total ECR ER-R ER - NHG Total 2005 683 1,731 713 3,127 457 1,592 309 2,358 2006 672 1,805 703 3,180 410 1,638 291 2,339 2007 768 2,053 699 3,520 436 1,810 249 2,495 2008 710 1,944 680 3,334 426 1,718 252 2, 396 2009 503 1,850 819 3,172 298 1,481 278 2,057 2010 513 1,864 902 3,279 305 1,348 264 1,917 2011 457 1,835 1,137 3,429 250 1,363 373 1,986 2012 480 1,848 1,102 3,430 298 1,438 399 2,135 2013 474 1,853 1,128 3,455 284 1,404 338 2,026 2014 427 1 ,647 1,060 3,134 280 1,324 401 2,005 1 Only includes Discovery Grant Individual 9 Table Discovery Grants¹ Competition Results by UniversityCompetition Universities Success Rate (%) Total Awarded ($) Average Grant ($) Success Rate (%) Total Awarded ($) Average Grant ($) Success Rate (%) Total Awarded ($) Average Grant ($) Acadia UniversityN/AN/AN/A27,00027,000Algoma UniversityN/AN/AN/AN/AN/AN/AAthabasca UniversityN/AN/AN/ABishop's UniversityN/AN/AN/ABrandon UniversityN/AN/AN/ABritish Columbia Institute of TechnologyN/AN/AN/ABrock UniversityN/AN/AN/A216,00024,00059,00029,500Cape Breton UniversityCarleton University177,00025,2861,087,09643,484364,00026,000Centre de recherche informatique de MontréalN/AN/AN/AN/AN/AN/AConcordia University859,00035,792321,00024,692Dalhousie University242,00026,889998,50036,981197,00028,143École de technologie supérieure143,90023,983307,00027,909179,00022,375École Polytechnique de Montréal244,00027,111901,50032,19684,00021,000Grant MacEwan University54,00018,000N/AN/AN/AHEC MontréalN/AN/AN/A134,00026,800Institut national de la recherche scientifique806,00040,300Lakehead University87,00021,750117,00023,40064,00021,333Laurentian UniversityN/AN/AN/A61,00030,50063,00031,500McGill University478,00028,1182,731,00036,905653,73632,687McMaster University153,00025,5001,997,00036,309403,00033,583Memorial University of Newfoundland135,00022,500474,00027,882367,00028,231Mount Allison UniversityN/AN/AN/A132,00033,00087,00029,000 Mount Royal UniversityN/AN/AN/A Mount Saint Vincent UniversityN/AN/AN/AN/AN/AN/A Nipissing University Queen's University67,17222,3911,646,00038,279217,00031,000 Redeemer University CollegeN/AN/AN/AN/AN/AN/A Royal Military College of Canada137,00027,400 Royal Roads UniversityN/AN/AN/AN/AN/AN/A Ryerson University22,00022,000567,00027,000161,00023,000 Saint Mary's University107,05221,41033,00033,000 Simon Fraser University146,00029,2001,992,00034,947382,00027,286 St. Francis Xavier UniversityN/AN/AN/A169,30033,86045,00022,500 Télé-universitéN/AN/AN/A The King's University College (Edmonton)N/AN/AN/AN/AN/AN/A The University of British Columbia474,00029,6253,645,38037,973554,10027,705 The University of Western Ontario357,80032,5271,638,34832,767712,73829,697 The University of Winnipeg49,00024,500 Thompson Rivers University74,00024,667 Trent UniversityN/AN/AN/A39,00039,000 Trinity Western UniversityN/AN/AN/A TRIUMFN/AN/AN/A Université de Moncton93,00031,00019,00019,000Université de Montréal343,00031,1822,112,00040,615342,00034,200Université de Sherbrooke156,00026,0001,290,30044,493154,00025,667Université du Québec à Chicoutimi111,00022,20043,00021,500Université du Québec à Montréal73,00024,333491,00035,071105,00026,250Université du Québec à Rimouski183,00036,600Université du Québec à Trois-Rivières146,00029,20075,00025,000Université du Québec en Abitibi-TémiscamingueUniversité du Québec en OutaouaisUniversité Laval437,00031,2141,284,00037,765388,00025,867University of Alberta523,00026,1503,145,60037,448545,00025,952University of Calgary333,90027,8252,074,00037,036506,91926,680University of Guelph312,00028,3641,104,00035,613414,00027,600University of Lethbridge237,00039,500152,00030,400University of Manitoba210,00026,250985,00031,774395,00030,385University of New Brunswick248,00027,556107,00026,750University of Northern British ColumbiaN/AN/AN/A80,00026,667University of Ontario Institute of Technology137,50022,917149,00024,83395,00019,000University of Ottawa212,00026,5001,837,50039,946343,95028,663University of Prince Edward Island54,00054,000University of Regina27,00027,000164,00020,50025,00025,000University of Saskatchewan227,00028,3751,119,80736,123293,00032,556University of the Fraser ValleyN/AN/AN/AN/AN/AN/AUniversity of Toronto476,00026,4445,453,88444,7041,164,38633,268University of Victoria1,466,00041,886195,00027,857University of Waterloo468,00023,4002,945,00036,358379,00031,583University of Windsor439,00029,267169,00028,167Vancouver Island UniversityN/AN/AN/AN/AN/AN/AWilfrid Laurier University119,00029,750124,00024,800York University203,00025,375646,40029,382103,00025,750Grand Total7,586,70826,99949,123,36736,55011,555,82928,463 Established Researchers - Not Holding a Grant Early Career Researchers Established Researchers - Renewing ¹Includes Discovery and Subatomic Physics Individuals and Team Grants but, excludes Subatomic Physics Projects* Less than five applications 10 Table Statistics byUniversity Size, Competition Category of Applicants Data LargeMediumSmallSuccess RateTotal Amount$5,961,872$913,900$710,936Average Grant$27,730$24,700$24,515Success RateTotal Amount$40,366,819$5,924,496$2,832,052Average Grant$38,010$33,284$27,231Success RateTotal Amount$8,323,829$1,941,000$1,291,000Average Grant$29,517$26,230$25,820 University Size Early Career Researchers Established Researchers - Renewing Established Researchers - Not Holding a Grant Table 5Success Rateby Category of Applicants and University Size 201020112012201320142010201120122013201420102011201220132014 Early Career Researchers Established Researchers - Renewing 76%78%81%80%83%69%52%72%69%74%65%55%63%57%63% Established Researchers - Not Holding a Grant 35%38%42%34%42%36%36%33%24%37%18%19%19%21%23% Large Medium Small As a result of peer review, applications are placed in 16“quality bins” based on their merit against the three selection criteriausing a six point scale Excellence of Researcher (EoR), Merit of Proposal (MoP), and Contribution to the Training of High Quality Personnel (HQP). Figure shows the distribution of applications for Early Career Researcher, Established Researchers Renewing their grant(ERR), and Established Researchers Not Holding a Grant (ERNHG)at the time of applicationbetween 2009 and and the same distribution for the competition. Budget permitting, NSERC aims to support Established Researchers to BinJ (which corresponds to ratings of Strong on three criteria or equivalent) and ECR to BinK or Bin 11 Figure Distribution of Applicationsby Quality Bin a) 2014 ompetition b) 2009013 Competitions Does not include results for Subatomic Physics Table 6Number of applicationsby Quality ins by University ize2014 ompetition NumberPercentageNumberPercentageNumberPercentage0.0%0.0%0.0%0.2%0.2%0.0%0.7%0.2%0.0%2.0%1.0%0.2%3.8%1.6%0.7%5.5%3.2%1.4%8.9%5.7%2.3%11.0%9.5%4.3%14.2%11.1%9.8%18.7%20.0%18.4%15.0%17.8%20.2%11.1%17.4%19.0%6.3%8.1%15.0%1.7%2.6%5.0%0.8%0.6%2.5%0.2%1.0%1.4%Total100.0%100.0%100.0% Does not include results from Subatomic Physics University Size Bin Large Medium Small 12 he rating pattern of pplications in Bin K, which usually is the first bin not funded for EstablishedResearchersis presented in Figure 9. Bin K generally corresponds to receiving two ratings of Strong and one Moderate. Other combinations such as a Very Strong, a Strong, and an Insufficient; or two ratings of Moderate and a Very Strongmake up the rest of the cases.Figure 9Percentage of Occurrences of Various Combinations of Ratingsin Bin K by University Size MSS: Moderate for EoR, Strong for MoP, Strong forHQP SMS: Strong for EoR, Moderate for MoP, Strong forHQP SSM: Strong for EoR, Strong for MoP, Moderate for HQP 13 SECTION STATISTICS BY EVALUATION GROUPTable Success Rate, Average Grant and Total Amount Awarded by Category of Applicant for ach valuation roup2014 Competition RenewingNot Holding a GrantSuccess RateAverage Grant$37,527$44,601$39,409Total Amount Awarded$1,163,336$5,218,271$3,034,469RenewingNot Holding a GrantSuccess RateAverage Grant$30,733$36,767$27,579Total Amount Awarded$1,383,000$6,324,000$2,151,124RenewingNot Holding a GrantSuccess RateAverage Grant$26,563$37,592$25,875Total Amount Awarded$425,000$3,571,196$828,000RenewingNot Holding a GrantSuccess RateAverage Grant$34,273$61,359$35,667Total Amount Awarded$377,000$6,074,500$428,000RenewingNot Holding a GrantSuccess RateAverage Grant$25,500$44,747$28,043Total Amount Awarded$357,000$5,190,600$645,000RenewingNot Holding a GrantSuccess RateAverage Grant$27,750$40,697$34,821Total Amount Awarded$666,000$3,622,000$975,000RenewingNot Holding a GrantSuccess RateAverage Grant$25,072$36,835$25,594Total Amount Awarded$626,800$4,236,000$409,500 1501 - Genes, Cells and Molecules Early Career Researchers Established Researchers 1502 - Biological Systems and Functions Early Career Researchers Established Researchers 1503 - Evolution and Ecology Early Career Researchers Established Researchers 1504 - Chemistry Early Career Researchers Established Researchers 1505 - Physics* Early Career Researchers Established Researchers *Includes Subatomic Physics Discovery Individual and Group, but not Projects 1506 - Geosciences Early Career Researchers Established Researchers 1507 - Computer Science Early Career Researchers Established Researchers 14 RenewingNot Holding a GrantSuccess RateAverage Grant$14,579$18,354$15,989Total Amount Awarded$277,000$2,698,000$399,736RenewingNot Holding a GrantSuccess RateAverage Grant$22,549$25,644$21,250Total Amount Awarded$721,572$3,026,000$850,000RenewingNot Holding a GrantSuccess RateAverage Grant$25,000$35,183$24,741Total Amount Awarded$650,000$3,835,000$668,000RenewingNot Holding a GrantSuccess RateAverage Grant$25,353$32,959$24,042Total Amount Awarded$431,000$2,834,500$577,000RenewingNot Holding a GrantSuccess RateAverage Grant$24,238$30,781$24,583Total Amount Awarded$509,000$2,493,300$590,000 1508 - Mathematics and Statistics Early Career Researchers Established Researchers 1509 - Civil, industrial and Systems Engineering Early Career Researchers Established Researchers 1510 - Electrical and Computer Engineering Early Career Researchers Established Researchers 1511 - Materials and Chemical Engineering Early Career Researchers Established Researchers 1512 - Mechanical Engineering Early Career Researchers Established Researchers The distribution of pplicationby quality bins is presented in Figure 9 for each Evaluation Group(EG). Thin alue illustrated representsthe value of the bin forthe normal cost of researchfor Establish Researchers (ER)For Es marked with a star (*), a differential for thecost of research was used andas a resultindividual grant values within a bin may be lower or higher than indicated 15 Figure Distribution of the Fraction of ApplicationQualityBinfor Each valuation roup201CompetitionGene,Cells and MoleculesBiological Systems and Functions 16 Evolution and EcologyChemistry 17 PhysicsexcludingSubatomic Physics) Geoscience 18 Computer ScienceMathematics and Statistics 19 Civil, Industrial and Systems EngineeringElectrical and Computer Engineering 20 Materials and Chemical EngineeringMechanical Engineering 21 SECTION STATISTICS BY GENDERAs part of NSERC’s commitment to gender equality, processes and competitions are monitored to ensure that no potential bias affects the evaluation of any submission.Data has been pooled over four competitionto ensure sufficient numbers in each category. Regular analysis of the outcomes of the Discovery Grants competitions reveals that male and female applicants have relatively similar success rates 66 percent for males, percent for females); and average grants ($34,757for males; $32,634for femalesThe difference inaverage grant is largely attributable to the career stage of applicantswith a larger proportion of female applicants who are assistant or ssociate rofessors as compared to male applicants (Table ). Table 8Proportion of Applicants by Gender and Career StageCompetitions Gender Male Female Assistant Professor 22% 35% Associate Professor 30% 33% Professor 40% 26% Adjunct, Emeriti & Other 9% 6% Similar results are observed for both males and females for applicants at equivalent career stages (Figure ) and ofthe same applicant status (Figure Success rates vary between the disciplines (Figure 13). 22 Figure 1Discovery Grant Success Rate and erage Awarded Amount by Career Stage and G2011ompetitionsigure 1Discovery Grant Success Rate and Average Grant by Applicant Status and ompetitions 23 Figure 1Discovery Grant Success Rate by Gender and Evaluation Grouompetitions 24 SECTIOESEOOLSAND INSTRUMENTSTable 9 Overall Comparative StatisticsResearch Tools InstrumentsCompetition 2012 2013 2014 Requested Amount $125,220,062 $101,958,582 $51,330,842 Awarded Amount $24,926,407 $24,343,810 $17,546,570 Funding Rate 20% 24% 34% Number of Applications 1,538 1,262 468 Number of Awarded Applications 301 295 157 Success Rate 20% 23% 34%