/
Confidently Committing to a Distribution Center Confidently Committing to a Distribution Center

Confidently Committing to a Distribution Center - PDF document

alexa-scheidler
alexa-scheidler . @alexa-scheidler
Follow
452 views
Uploaded On 2016-09-27

Confidently Committing to a Distribution Center - PPT Presentation

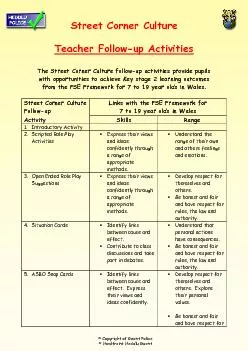
Page 1 of 15 Design When Demand is Unpredictable Part I Developing a Storage Design Tool S u p p l y C h a i n A d v i s o r s L L C Commonwealth Supply Chain Advisors x2022 20 Park Plaza Sui ID: 470694

Page 1 of 15 Design When Demand

Share:

Link:

Embed:

Download Presentation from below link

Download Pdf The PPT/PDF document "Confidently Committing to a Distribution..." is the property of its rightful owner. Permission is granted to download and print the materials on this web site for personal, non-commercial use only, and to display it on your personal computer provided you do not modify the materials and that you retain all copyright notices contained in the materials. By downloading content from our website, you accept the terms of this agreement.


Presentation Transcript

Page 1 of 15 Confidently Committing to a Distribution Center Design When Demand is Unpredictable Part I Developing a Storage Design Tool S u p p l y C h a i n A d v i s o r s L L C Commonwealth Supply Chain Advisors • 20 Park Plaza, Suite 400 | Boston, Massachusetts 02116 (O) 617.948.2153 | (F) 617.507.6112 | www.commonwealth - sca.com Page 2 of 15 Table of Contents Introduction ................................ ................................ ................................ ................................ ................................ ...... 3 Uncertain Times ................................ ................................ ................................ ................................ ................................ ........... 3 Assumptions ................................ ................................ ................................ ................................ ................................ ................ 3 Creating a Storage Design Tool ................................ ................................ ................................ ................................ ....... 4 Compiling Source Data ................................ ................................ ................................ ................................ ............................... 4 Creating the Storage Design Tool ................................ ................................ ................................ ................................ .............. 8 Appendix A: Overall DC Design Process ................................ ................................ ................................ ......................... 13 Start Planning Your Distribution Center Today ................................ ................................ ................................ ................. 14 Additional Resources: ................................ ................................ ................................ ................................ ............................... 14 About Commonwealth Supply Chain Advisors ................................ ................................ ................................ ........................ 14 About the Authors ................................ ................................ ................................ ................................ ........................... 15 Commonwealth Supply Chain Advisors • 20 Park Plaza, Suite 400 | Boston, Massachusetts 02116 (O) 617.948.2153 | (F) 617.507.6112 | www.commonwealth - sca.com Page 3 of 15 Confidently Committing to a D istribution C enter Design When Demand is Unpredictable – Part 1 Developing a Storage Design Tool Introduction Uncertain Times “The future ain’t what it used to be.” Yogi Berra Many companies that have experienced growth over the last few years have been reluctant to make major changes to their distri bution centers (DCs) due to unpredictable demand patterns. After the last decade of change, it seems the only thing certain is uncertainty about growth levels, SKU proliferation, e - commerce changes, and a host of other factors. Companies are reluctant to expand their DCs, invest in m ajor distribution automation, or to upgrade their WMS systems. If the passage of time has not made the future any clearer, th e best course of action for growing companies is to invest in flexible technology and designs that can rapidly scale up, scale down , or be reconfigured to meet future needs. This report – first of a series – discusses some new ways for companies to approach their DC design decisions with confidence, despite a less - than - ideal view of the future. It discusses the value of a new class of D C Design Tools . These applications can quickly show a company the storage and throughput implications of a wide range of potential growth scenarios. The tools, which are based on actual SKU - level sales data from the company, usually feature an interactiv e dashboard where variables like volume growth, SKU proliferation, inventory policy, replenishment method, and so on can be actively manipulated by a user. As these variables are changed, the tool displays real time DC storage requirements – what storage m ediums should be used, how many pick - faces will be required, and what pick rates will be needed. Using a DC Design Tool may not help build a better forecast, but it can show whether a proposed de sign will be flexible enough to adapt to a wide range of futu re scenarios. In today’s uncertain age, “flexibility” is often the overriding design principal for distribution centers , and can help break the decision paralysis that many companies are experiencing with their DC design plans. Assumptions This report out lines the concepts and methodology to create a Storage Design Tool. While many of the underlying principals in distribution are the same from one company to the next, each business has unique requirements: special product categories, sp ecial order types, s pecial handling characteristics. The goal of this rep ort is not to be a line - by - line coding guide to create a completely comprehensive design tool for all businesses. The objective is rather to discuss the manner in which to incorporate the major design co ncepts with which most businesses must contend as they design a distribution center (DC) . The tools described in this document are built in a spreadsheet or other database tool, and not within a commercial design ap plication. In many cases, Commonwealth fa vors the use of spreadsh eets as they can be created, revised , and quickly understood by most users. Part 1 of this paper focuses on analyzing the storage requirements for DCs . Subsequent releases in this series will discuss how to create a throughput design tool, and how to evaluate the results of both tools to determine appropriate storage and handling equipme nt for the DC . Commonwealth Supply Chain Advisors • 20 Park Plaza, Suite 400 | Boston, Massachusetts 02116 (O) 617.948.2153 | (F) 617.507.6112 | www.commonwealth - sca.com Page 4 of 15 Creating a Storage Design Tool Compiling Source Dat a The first step towards a flexible distribution center (DC) design is to create a data model of the operation. The data model should accurately represent the historical and present state of the DC, but should also allow the user to easily experiment with various sales forecasts, various SKU proliferation scenarios, and other variables which govern the storage strategy. While it is possible to arrive at a sound DC design by skipping the data analysis step and conducting site surveys of the product to be stored, it is very difficult to forecast future needs using the site survey method alone. One of the most common reasons for sub - optimal results in DC design projects is sub - optimal data – not just poor data quality, but poor data gathering processes and poor handling of outliers. Taking an incomplete or un - validated data set and simply starting the analysis is a certain recipe for either inaccurate results or significant replication of work. With this approach, errors and omissions in data are often not discovered until midway through the analysis requiring extensive rework. Good Data Gathering Practices  Identify Future Scenarios: Before sitting down to compile data, a company should first go through an exercise to determine the range of potential future scenarios that are to be considered. Is the company considering constructing a new DC ? Is the company considering expanding the current DC? Will some inventory be held offsite in an overstock facility? Is there no room for expansion, meaning that the solutions must be limited to making better use of existing space? What general material handling solutions are being considered? Will the solutions be lim ited to vehicle and conveyor - based systems, or will more automated goods - to - picker systems also be up for discussion? Is there an ongoing inventory reduction initiative underway? Is a merger or acquisition in the works? The answers to these questions will help a company focus on its specific areas of need.  Identify the “Results” Metric s: Once the range of future scenarios has been laid out, attention should next be given to the specific metrics which will help a company determine which designs make the most sense. Some key metrics which may need to be analyzed include: type and quantity of storage mediums required for both forward pick and overstock areas, throughput required at peak periods (lines picked per hour), handling unit throughput required (cartons or totes per hour), and other similar figures. It is also important to give thought to whether the results will need to be viewed by product category or business u nit (i.e. how many flat garments will need to be stored vs. hanging garments). Create a deta iled list of all the metrics to be considered.  Identify Variables Which Will Impact Growth: What factors will influence the design of the DC five or ten years down the road? Obvious variables include volume growth, SKU proliferation, and growth in key chan nels (like e - commerce). Other important variables to consider are inventory policy (weeks of supply on hand), replenishment interval for the forward pick area, growth of non - conveyables, and increased need for segregation by lot number of manufacturing dat e. Some variables may move in different directions based on product category. Each variable for each category should be defined (i.e. 5 variables x 4 product categories = 20 variables).  Identify Data Requirements : Determine the data which will be needed to calculate the results. This step requires real thought to connect the dots between data, variables, and results. For instance, if the goal is to view the number of carton - flow lanes required in the DC based on three different levels of volume growth by pr oduct family, then the source data will need to include sales volume by SKU with a field identifying the product family for each SKU.  Determine Baseline Data Range: It is important that a sensible baseline data set be used in the analysis. A good rule of t humb is to use the smallest data set which will provide reliable results. For instance, for companies with stable growth and littl e or no seasonality, a three - month history of sales and procurement is often sufficient. However, for companies with significa nt increases in business during certain times of the year, a twelve month history may be required to paint an accurate picture o f the ebbs and flows of product in the DC . Additionally, if the most recent period of time reflects a non - characteristic distri bution pattern, it may be advisable to use a more representative period of time for the baseline model.  Create a Formal Data Request: To avoid needless replication of work, it is vital to create a clear, written data request so that the individuals respons ible for compiling the data have unambiguous instructions as to what is expected. It is also helpful to include these individuals in a discussion as to the overall goals of the data analysis so that they may be able to provide an y additional suggestions as to which data should be compiled. “ One of the most common reasons for sub - optimal results in DC design is sub - optimal data .” Commonwealth Supply Chain Advisors • 20 Park Plaza, Suite 400 | Boston, Massachusetts 02116 (O) 617.948.2153 | (F) 617.507.6112 | www.commonwealth - sca.com Page 5 of 15  Create Replicable Reports: It is rare that the first attempt at data compiling produces the final database to be used in the analysis. Given that at least two iterations of analysis may be conducted, it is important to cr eate standard, replicable reports which can be run to compile the data in a consistent manner each time. Perhaps more importantly, in order for the design tool to be a useful device far into the future, new data sets must be able to be u ploaded from time - t o - time and re - analyzed. It is important to be able to re - create the same data reports easily and consistently.  Export the Data: In most cases, the data will need to be exported from the company’s ERP system or reporting engine into a Microsoft Excel or Acc ess database where the data can easily be incorporated into the new design tool. A Crucial First Step: Data Validation Before beginning any analysis, careful validation must take place to ensure that the data set conforms to the requirements in the data request. Typical steps in validation include:  Confirm fields: Ensure that all of the requested fields have been provided. Highlight any extraneous fields and have them removed from the report to keep the data file size manageable.  Clarify field details: Ca refully review each field to determine what units are being used so that results are interpreted properly. Are measurements in millimeters or inches? Are sales in units or order lines?  Check formatting: Ensure that the data in each field is properly form atted with no errors. As an example, the “quantity on hand” field should consist of positive integers. Product categories should be consistent with no typographical errors. (i.e. “Appar el” vs. “Apparrel”).  Check c onsistency: The data will often be delivered in the form of multiple tables. In order to cross reference and compile a master list, it is important to make sure that the part numbers are consistently formatted. Simple differences like punctuati on (223 - 1 vs. 223/1) can prevent proper cross referencing. In many instances, the formatting can cause issues that are not easily identifiable (i.e. numbers formatted as text, part numbers with leading zeros that have been dropped, etc.) In some cases, S KUs will be missing from certain data files. F or example, the sales history may list a certain quantity sold of a given SKU while the inventory snapshot does not list the SKU at all. Does this mean that the SKU was not in stock when the snapshot was taken? Or was it inadvertently left out of the data set? Questions like this must be researched.  Check pack sizes: A common source of errors, especially with product cube, involves mistakes with pack sizes. For instance, the dimensions on file may refer to a 6 - pack of product, rather than an individual unit . Careful attention should also be paid to odd pack sizes and units of measure. Reels of product stocked in linear inches or containers of product stocked in ounces ca n wreak havoc on a storage calculation.  Summarize data and review ranges: Each field sh ould be summarized and the ranges of values should be listed. For example, cubic volume of produ ct for all SKUs may range from 15 cubic feet to 100,000 cubic feet. These ranges offer an opportunity to perform some basic sanity checks, as extreme values may illustrate a simple data entry error.  Manage outliers: I t is important to manage outlying data points in a consistent, sustainable way. Rather than changing incorrect data in the spreadsheet, the data should either be changed in the master database, or el se minimum and maximum value adjustments should be made in the design tool. These adjustments must be made in a way that will enable future data uploads to be validated and adjusted without requiring manual changes to data. Commonwealth Supply Chain Advisors • 20 Park Plaza, Suite 400 | Boston, Massachusetts 02116 (O) 617.948.2153 | (F) 617.507.6112 | www.commonwealth - sca.com Page 6 of 15 In the Absence of Data…S urvey! In some cases, there simply isn’t enough good quality data to create a reliable design. When this happens, it’s time to roll up the sleeves and survey the DC , collecting visual information on what needs to be stored. There are generally four methods which can be used to gather this information: Check s and Balances Even if “good” product cube data is available, it is almost always advisable to check the result of a Method # 1 analysis by performing one of the other three analyses. The results should be rela tively similar. If they are not, then an effort should be made to understand why the discrepancy exists. It is due to a normal margin of error in one of the methods? Is an assumption incorrect? Reconciling the two methods will often provide valuable insigh ts into the operation that would not be obtained otherwise. Typical Data Sets  Item Master o SKU # o Description o Unit of measure o Dimensional data  Length  Width  Height o Weight o Qty. of units in a case o Qty. of cases on a pallet o Pallet height o Pallet Ti - Hi o Other product attributes  Location Master o Bin # o Storage medium type o Warehouse z one o Bin dimensions  Historical Sales Orders  Inventory Snapshots  Historical Purchase Orders Deep Dive: Gathering and Maintaining Cube Data An accurate database of the cubic dimensions and weights of every SKU is a key requirement for data - driven DC design. There are actually a number of reasons that this data is important t o maintain beyond pure DC design, such as the following processes and initiatives:  Ongoing slotting initiatives • Product Cube: Use a database of product dimensions. Method #1 • Surveyed Storage Cube: Survey each item in each bin in the DC. Record the SKU number and capture some information as to the amount of space occupied by that SKU in the DC. Method #2 • Utilized Bin Cube (bin - by - bin): Measure the dimensions of each bin, and capture the rough percentage of space in each bin which is occupied by product. (Not a SKU - specific method) Method #3 • Utilized Bin Cube (aggregate): Measure the dimensions of each bin, and determine a general utilization factor that applies to each bin type. (Not a SKU - specific method) Method #4 Commonwealth Supply Chain Advisors • 20 Park Plaza, Suite 400 | Boston, Massachusetts 02116 (O) 617.948.2153 | (F) 617.507.6112 | www.commonwealth - sca.com Page 7 of 15  Bin replenishment calculations  Cartonization calculations (to enable picking directly to the shipping container)  Directed put - away calculations Companies typically fall into three categories in regards to maintaining dimensional data: 1. Companies that have cube data and actively use it: These companies are in the best position to begin a data - driven DC design project. The data exists, and has been r eal - world - tested in some respects, such as by using the data for cartonization or other purposes. Hopefully, the most egregious data errors have been identified and corrected, and the data set is fairly reliable o verall. 2. Companies that have cube data but h ave not yet used it: While the heavy - lifting of gathering the data has been completed, the accuracy of the database should be viewed as highly suspect until it has been tested in actual use. Data errors are extremely easy to make, and can significantly thr ow off the results of an analysis if not identified. Companies in this situation should pay close attention to the Data Validation suggestions in the preceding section. 3. Companies that have not yet gathered cube data: These companies have some work ahead of them, to be sure. There is no time like the present to begin gathering this data. As the paragraph above points out, good cube data can very useful. Companies should immediately begin building this database based on the guidelines listed below. There are several methods for gathering cube data, each with its own merits:  Hand - measuring: For companies with less than 5,000 SKUs, this may be a viable method of data gathering. Each SKU is hand - measured and a paper list is maintained, which is eventually logged into a proper database. While this method does not involve expensive equipment, it is very time consuming and prone to measuring errors and inconsistencies.  Cubing devices: Ultrasonic cubing devices have been in use for many years and are a reliable means of gathering dimensional data on SKUs. A device fr om Cubiscan is shown in figure 1 . A SKU is placed in the target area of the device, and then a series of ultrasonic waves measures the dimensions of the object in a matter of seconds. The weight can a lso be simultaneously captured. If the item is bar - coded, then the SKU number can be scanned as well. Cubing devices are a fast way to capture dimensional data for a large number of SKUs. The technology, however, is not inexpensive. If the data gathering is likely to be a one - time exercise and new parts are introduced in relatively small quantities, then a company should investigate renting a device for a month or two to build the database. Cub ing devices can often be mounted on a cart with a portable power supply to allow workers to walk through the distribution center and scan each item, rather than having to move product to the device. This is often a more efficient way to gather the data. Cu bing devices usually capture the data and write them to a very simple database which can then be imported into a spreadsheet. Several user - defined fields are usually available as well.  Manufacturer - provided data: The manufacturer’s product specifications c an be another source of dimensional data. In Commonwealth’s experience, the accuracy and formatting of this data varies greatly from company to company. Caution should be used when utilizing data from this source. As noted previously, one of the most comm on sources of dimensional errors lies in the improper capturing of pack - size data. As the cubing exercise begins, the individuals capturing the data should be thoroughly trained on the correct method for noting pack sizes. It is usually advisable to captur e as many pack sizes as possible for a single product (i.e. unit dimensions, inner - pack dimensions, master pack dimensions). For product which either arrives or ships on a pallet, this is usually a good time to capture the TI - HI information (number of case s per tier, number of layers per pallet). It is also a good idea to have the dimensional data gathered by a small, core group of workers to ensure consistency in the manner in which pack sizes are accounted for. It is important to note that parts come in many shapes and sizes and this can often cause misleading results. Many items can be neatly nested and can be stored in a fraction of their calculated storage requirements, while other items may be fragile or awkwardl y shaped Figure 1: Cubing Device Image Source: Quantronix, Inc. Commonwealth Supply Chain Advisors • 20 Park Plaza, Suite 400 | Boston, Massachusetts 02116 (O) 617.948.2153 | (F) 617.507.6112 | www.commonwealth - sca.com Page 8 of 15 and require additional storag e. Keep this in mind when reviewing storage allocations and assume that some adjustments will most likely be required in practice, but the results are typically adequate for general planning purposes. After a meaningful group of data has been collected, t his partial data set should be validated, outliers should be examined, and any necessary adjustments should be made to the data collection practices. Creating the Storage Design Tool Now that an accurate and complete data set has been compiled, the next st ep is to develop the first of the two design tools: the Storage Design Tool. Commonwealth generally advises that the Storage Design To o l be completed prior to the Throughput Design Tool as the results provide vital information regarding the amount of space in the distribution center (DC) which will have to be allocated for storage – both in forward picking and in overstock. This will also determine the remaining space available for things like packing and shipping, buffering, sortation and other functional areas. The purpose of the Storage Design Tool is to allow a user to manipulate key variables like volume growth and SKU proliferatio n, and see – in real time – the storage requirements for each scenario. (Figure 2) Figure 2 . Growth Variables and Design Tool Output Example Design Concepts Thirteen key design concepts are discussed below. The specific way that these concepts must be incorporated into the design tool will be discussed in the following sections. General Concepts 1. Conservative inventory policy: Many companies assume that over the course of a DC design project, they will finally get their inventory over - supply problem under control. While this is a laudable goal, our experience suggests that changing inventory policy is a difficult process that does not necessarily occur simply because a DC re - design takes place. Commonwealth recommends making very conservative assumptions regarding reduction in average weeks of supply on hand in the DC. Overstock Concepts 2. Minimum pur chase quantity: Many SKUs have a minimum re - order quantity from the vendor. It is prudent to allocate enough space in the DC to house at least this minimum re - order quantity. 3. Overlapping replenishment: In most cases, the new supply of a SKU will arrive fro m a vendor prior to the existing supply being completely depleted. This creates a condition of “overlapping replenishment” in the DC which must be accounted for. 4. Inventory draw - down: After a new supply of inventory arrives, it is progressively drawn down t o a certain level before the next supply arrives. 5. “Top - off logic”: In most instances, the bin which is designated to house a given SKU may be slightly larger than required. As an example, only 1.2 pallets of a SKU may be needed on hand, but 2 full pallet p ositions have been allocated for it. In this case, 80% of one of the pallet bins is empty. If a new supply of the SKU arrives and will occupy 50% of a pallet position, then thi s new supply can be used to “top off” the partially full pallet location and no new space needs to be allocated for it. Variable 1 Variable 2 Variable 3 Variable 4 Output 1 Output 2 Output 3 Output 4 Expected SKU Proliferation (5 Years) Expected Volume Growth (5 Years) Inventory Policy, Method A: Projected Change in Weeks of Supply On-Hand Weeks of Supply, Forward Pick No. of Bins Required No. of SKUs Slotted In This Bin Type No. of Units Stored In this Bin Type Single- Location SKUs Health & Beauty 7.0% 18.0% -12.0% 2.0 Static Shelf, 12 x 12 x 14 11,376 9,987 890,456 Cosmetics 14.0% 15.0% 0.0% 2.0 Carton Flow, 102 x 12 x 10 15,823 13,002 2,700,435 General Merchandise 1.0% 3.5% -20.0% 2.0 Pallet Flow, 96 x 40 x 60 298 300 166,954 Seasonal 5.0% 7.0% -20.0% 4.0 Subtotal, Forward Pick Area: 27,497 23,289 3,757,845 Other 1.0% 10.0% -20.0% 2.0 Decked Rack, 42 x 24 x 24 7,001 6,997 890,986 Total 9.1% 11.2% Pallet Rack, 48 x 40 x 30 765 867 360,963 Pallet Rack, 48 x 40 x 60 2,624 1,823 1,744,568 Pallet Rack, 48 x 40 x 80 88 45 1,899 Subtotal, Overstock Area: 10,478 9,732 2,998,416 Grand Total 37,975 6,756,261 16,558 Overstock Area Growth Variables Product Categories Design Outputs Bin Type Forward Pick Area Commonwealth Supply Chain Advisors • 20 Park Plaza, Suite 400 | Boston, Massachusetts 02116 (O) 617.948.2153 | (F) 617.507.6112 | www.commonwealth - sca.com Page 9 of 15 Forward Pick Area Concepts 6. Pack sizes: Generally, the minimum quantity of a SKU which will be kept in the forward pick area is a single case of the product. This will simplify replenishment and ensure that split - case s are not stored in the overstock area. Therefore, if the target supply in the forward pick area is less than a full case of product, then space to store a full case must be allocated. 7. Bin break points: After specific bin sizes have been defined, it is im portant to determine the maximum number of that bin type that any one single SKU is allowed to occupy before being slotted in the next larger bin type. For example, it is common to specify that if any one SKU occupies more than four or five lanes of carton flow rack, that it will be stored on a pallet instead. 8. Bin utilization factors: In most cases, product will not full y occupy all of the available space within a bin for various reasons. When allocating parts based on data, bin utilization factors must be used to reduce the total available space in a bin to the amount of space that will reasonable be utilized by product. 9. The 95% rule: This rule states that if 95% of the supply of a SKU will fit in the forward pick area, then the entire supply o f the SKU sho uld be slotted there. This avoids having small overstock quantities of item which is often not space efficient. The 95% factor can be setup as an adjustable variable. 10. The “one - case” rule: In forward pick areas, if only one case of a SKU will fit in the fo rward pick bin, then it is usually wise to allocate space for at least two cases to allow for overlapping replenishment . 11. Longest Dimension: It is usually wise to determine forward pick bin size based upon a SKU’ s longest dimension in addition to pure cubic volume . 12. Conveyability/Packability: If the forward pick area is to be within a conveyor - based system, then it is wise to consider whether a SKU is capable of being conveyed by itself on a conveyor system, or whether it is able to be re - packed within a ship ping container . 13. Weight: In piece - pick forward pick areas, it is often a good idea to designate a maximum weight of a particular SKU that will be allowed in this area for ease of handling. Structure of the Design Tool Proper forethought must be given to the overall structure of the design tool. For the purposes of this document, we will assume that the design tool is being built in a spreadsheet, although other database tools can certainly be used as well.  Raw data worksheets: For every report which must be exported from a host application, a separate worksheet should be created in the design tool. The data from the report should be pasted into the worksheets in completely raw format to allow for futur e data sets to be easily added to the workbook without com plex reformatting needing to occur.  Master data worksheet: This worksheet will serve as a means of compiling all of the known data for a given SKU. It can either be a standalone worksheet, or the Item Master worksheet can be used as a starting point. If th e latter option is chosen, it is vital to protect the raw item - master data and not allow it to be edited. Whatever option is chosen, the Master D ata worksheet cross references data from the Historical Sales Orders, Inventory Snapshots, and Historical Purch ase Orders worksheets. Most of the major calculations at the SKU level will be performed in this worksheet.  Storage Medium Worksheet: This worksheet is used to define the various storage mediums which will be considered for the DC . The dimensions of each medium is specified, as well as rules such as utilization factors and breakpoints.  Dashboard Worksheet: This is the main user interface for the completed workbook. It consists of two main components: o Variables: The variables (such as projected growth, SKU proliferation, etc.) which were identified at the outset of the project are specified here, and can be manipulated by the user to view the impact on storage requirements. o Outputs: Outputs are generally the quantity and type of storage mediums which will b e required in both the forward pick and reserve areas. Creating the Design Tool…in 13 Steps T his section defines the general steps involved in creating the Storage Design Tool. It should be emphasized that these are gu idelines only. Every DC is different, and the process of analyzing it should be adapted to the needs at hand. 1. Develop SKU List a. Compile a list of unique, active SKUs to be stored in the DC b. Collect historical sales data for each SKU c. Determine the average weekly sales for each SKU, taking note t hat some SKUs may not have been acti ve the entire historical period d. Determine the current on hand quantity for each SKU Commonwealth Supply Chain Advisors • 20 Park Plaza, Suite 400 | Boston, Massachusetts 02116 (O) 617.948.2153 | (F) 617.507.6112 | www.commonwealth - sca.com Page 10 of 15 e. Determine current weeks of sales on hand for each SKU f. Determine minimum vendor order size for each SKU 2. Create variables to adjust “weeks on hand” requirements a. Variable #1: Weeks of sales to be stored on hand for the entire DC b. Variable #2: Weeks of sales to be stored on hand for the forward pick area 3. Seasonality: Review seasonality and determine how it should be addressed (create a season ality adjustment variable if required) 4. Account for Growth a. Create Variable #3: Projected volume growth factor b. Create a growth - adjusted average weekly sales (Variable #3 x weekly average sales) c. Create growth - adjusted quantity on hand figure for each SKU (gro wth - adjusted average weekly sales x current weeks of supply) 5. Create Variable #4: Determine the minimum quantity to be stored in forward pick location (usually a percentage of the case size) 6. Target On Hand a. Determine the target quantity on hand in the DC fo r each SKU (variable #1 (target weeks on hand x growth - adjusted average weekly sales) ) b. Determine the target quantity on hand in the forward pick area for each SKU based on variable #2 (target weeks on hand in forward pick x growth - adjusted average weekly sales) c. Adjust for pack size by rounding the target quantity on hand (forward pick area) up to the next full pack qua ntity to simplify replenishment d. Adjust for current quantity on hand values: review the on hand quantities and adjust values that exceed the on hand storage goal, these values can often skew on hand storage totals 7. Product Dimen sions a. Determine overall cube of each SKU unit (length x width x height) b. Determine maximum dimension of each SKU (largest of length, width, and height dimensions) 8. Determine possible storage options a. Create a range of storage mediums (i.e. shelving, carton fl ow, pallet, etc.) b. Define length, width, height of each storage option c. Define a typical cube utilization percentage for each bin type d. Determine the maximum number of a given bin which can be occupied by a single SKU before the SKU is slotted in the next lar gest bin type e. Determine the maximum cube of product which is to be slotted in a given medium f. Define the longest dimension of an item which can fit in each bin 9. Using cube to allocate SKUs to storage mediums a. Determine the required cube to store the forward pick quantity for each SKU b. Determine the optimal forward pick bin for each SKU based on maximum cube c. Alternately, determine the optimal forward pick bin for each SKU based on longest dimension d. Select the largest of the two bins sizes (cube vs. longest dime nsion) e. Determine the number of bins required to house the target supply of each SKU in the forward pick area and adjust any items that exceed the maximum number of locations for that medium 10. Adjust for slow moving SKUs (aka “dogs”) a. Create Variable #5: Minim um weeks of sales to qualify for forward pick area b. Remove slow moving SKUs that do not meet variable #5 requirements from the forward pick areas 11. Tally storage bays a. Convert to equivalent bays: Determine the definition of a “bay” (often a bay is defined as a section between two structural rack uprights, 96” wide x 96” deep x ~60” tall) b. Determine how many of each bin type will fit in an equivalent bay (ex: 2 pallet flow bins fit in a bay, 25 lanes of carton flow fit in a bay, 120 shelf bins fit in a bay) c. Deter mine how many equivalent “bays” are required to house the supply of each SKU d. On the dashboard tab, display a running tally of the number of bays required to house a SKU 12. Tally overstock storage bays a. Determine the cubic volume of all of the bins allocated for a given SKU in the forward pick area b. Determine the maximum number of cases which can fit in the number of bins allocated (topped off quantity) c. Determine the overstock quantity (total quantity on - hand minus topped - off quantity in forward pick area) Commonwealth Supply Chain Advisors • 20 Park Plaza, Suite 400 | Boston, Massachusetts 02116 (O) 617.948.2153 | (F) 617.507.6112 | www.commonwealth - sca.com Page 11 of 15 d. Adju st overstock quantity for pack size: take quantity on hand in overstock area and round up to the nearest full case quantity e. Determine the cube of the adjusted overstock quantity f. Define an overstock pallet size g. Determine the number of standard pallet equiv alents required to store the overstock quantity of each SKU h. Create Variable #6: Rounding factor for overstock pallets: This factor determines the minimum fraction of a pallet which will be allocated for overstock storage. If set to “1”, then if a SKU requi res 1.2 pallets to house the overstock quantity, then the tool will allocate 2 full pallet positions for the storage. If set to “.5”, then the tool will only alloca te 1.5 pallets for the storage. i. Determine rounded quantity of overstock pallets required for each SKU j. Adjust for current quantity on hand: in many cases the assumption will be made that the quantity slotted in the overstock area will not exceed the growth adjusted total quantity on hand in the DC k. Determine if the minimum order quantity for a SKU exceeds the quantity slotted in overstock. If it does, then this additional supply mu st also be slotted in overstock l. Determine additional minimum order quantity to be slotted for each SKU m. Determine top - off space available in overstock for each SKU (if 1.2 pallets of storage are required, and 2 pallet positions are allocated for storage, then top - off space available = .8 pallets) n. Determine if the top - off space will be sufficient to absorb the additional minimum order quantity o. If not, then slot the additional minimum order quantity in additional pallet locations 13. Inventory Drawdown a. Create Variable #7: Inventory drawdown factor for facility replenishment (how many weeks of supply of each SKU will still be on hand when the next shipment arrives from the vendor?) b. Determine for each SKU how many overstock units will be freed up when the inventory draw - down occurs c. Determine the equivalent number of pallet positions which will be freed up d. Round the previous value to the nearest pallet rounding increment e. Determine if additional pallet positions are still required to house minimum order quantity even after inventory drawdown occurs f. Allocate space for these additional pallets if needed (overlapping replenishment pallets) Figure 3 Summary of Variables • Weeks of sales on hand in the DC Variable #1 • Weeks of sales on hand in forward pick area Variable #2 • Projected volume growth Variable #3 • Minimum quantity in forward pick (fraction of a case) Variable #4 • Minimum annual weeks of sales to qualify for forward pick Variable #5 • Rounding factor for overstock pallets Variable #6 • Inventory drawdown factor for facility replenishment Variable #7 • SKU Proliferation • 95% rule • Growth variables by family group • Capped values for managing outlying data points Other Variables Commonwealth Supply Chain Advisors • 20 Park Plaza, Suite 400 | Boston, Massachusetts 02116 (O) 617.948.2153 | (F) 617.507.6112 | www.commonwealth - sca.com Page 12 of 15 To be continued … The next installments in this series will discuss:  Creating a throughput design t ool  Using the design t ools to design flexible material handling systems Commonwealth Supply Chain Advisors • 20 Park Plaza, Suite 400 | Boston, Massachusetts 02116 (O) 617.948.2153 | (F) 617.507.6112 | www.commonwealth - sca.com Page 13 of 15 Appendix A: Overall DC Design Process The steps contained in this guide are part of a larger proce ss which has been developed by Commonwealth Supply Chain Advisors to design distribution centers when demand is uncertain. The overall steps in this process are: Determine Space Requirements (Covered in this installment of the series - Part I) Determine Pick Strategy (Covered in Part II of the series - October 2013) Determine Pick Methodology (To be covered in Part III of the series) Determine Inbound Processes (To be covered in Part IV of the series) Commonwealth Supply Chain Advisors • 20 Park Plaza, Suite 400 | Boston, Massachusetts 02116 (O) 617.948.2153 | (F) 617.507.6112 | www.commonwealth - sca.com Page 14 of 15 Start Planning Your Distribution Center Today Additional Resources : Paper: Confidently Committing to a Distribution Center Design When Demand is Unpredictable, Part II - Creating a Throughput Design Tool Ebook: 6 Ways to Postpone Distribution Center Expansion Paper: E - Commerce in the Distribution Center – Making a Graceful Transition Presentation: Im proving Warehouse Productivity W ithout Tier 1 Technology About Commonwealth Supply Chain Advisors Commonwealth is a leading supply chain consulting firm that helps companies of all sizes structure their supply chain networks, design distribution centers, and select and implement warehouse management systems (WMS). Commonwealth is based in Boston and w orks with clients across the globe. For more information, visit www.commonwealth - sca.com or contact Jennifer Thomas at (617) 948 - 2153 . Commonwealth Supply Chain Advisors • 20 Park Plaza, Suite 400 | Boston, Massachusetts 02116 (O) 617.948.2153 | (F) 617.507.6112 | www.commonwealth - sca.com Page 15 of 15 About the Author s Ian Hobkirk Mr. Hobkirk is the founder and Managing Director of Commonwealth Su pply Chain Advisors. Over his 20 - year career, he has helped hundreds of companies reduce their distribution labor costs, improve space utilization, and meet their customer service objectives. He has formed su pply chain consulting organizations for two different systems integration firms, and managed the supply chain execution practice at The AberdeenGroup, a leading technology analyst firm. His career has provided him with a broad perspective on how to solve s upply chain problems without automatically resorting to expensive technology. Mr. Hobkirk has authored dozens of white papers on supply chain topics, and his opinions have been featured in publications such as DC Velocity, Modern Materials Handling, and Th e Journal of Commerce. John Diebold Mr. Diebold is Director of Consulting for Commonwealth Supply Chain Advisors . Over his ca reer, he has designed over 100 distribution centers and led dozens of pure distribution center optimization initiatives. He has w orked for many of the top companies in distribution automation: FKI Logistex, White Systems, Kardex Remstar, and Sapient Automation which gives him a truly unique perspective on when and how to apply technology in the distribution center. Mr. Dieb old holds a Master of Industrial Engineering wi th focus on Systems Engineering from New Jersey Institute of Technology .