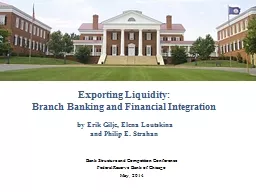
/
Exporting Liquidity: Branch Banking and Financial Integration Exporting Liquidity: Branch Banking and Financial Integration

Exporting Liquidity: Branch Banking and Financial Integration - PowerPoint Presentation

alexa-scheidler
alexa-scheidler . @alexa-scheidler
Follow
348 views
Uploaded On 2018-10-29

Exporting Liquidity: Branch Banking and Financial Integration - PPT Presentation

by Erik Gilje Elena Loutskina and Philip E Strahan Bank Structure and Competition Conference Federal Reserve Bank of Chicago May 2014 Key Change Integrating US Local Markets Financial integration savings in one market finances consumption amp investment in another ID: 701195

shale bank lending branch bank shale branch lending shocks county credit amp markets boom loans year local booms strahan

Share:

Link:

Embed:

Download Presentation from below link

Download Presentation The PPT/PDF document "Exporting Liquidity: Branch Banking and ..." is the property of its rightful owner. Permission is granted to download and print the materials on this web site for personal, non-commercial use only, and to display it on your personal computer provided you do not modify the materials and that you retain all copyright notices contained in the materials. By downloading content from our website, you accept the terms of this agreement.


Presentation Transcript

Slide1

Exporting Liquidity:Branch Banking and Financial Integration by Erik Gilje, Elena Loutskina and Philip E. Strahan

Bank Structure and Competition Conference

Federal Reserve Bank of Chicago

May, 2014Slide2

Key Change Integrating US Local MarketsFinancial integration: savings in one market finances consumption & investment in another.Extension of Bank Branch NetworksDeregulation within state (1970s ad 1980s)Deregulation across states (1990s and 2000s

)

Economic Effects

Lower cost of credit (Rice & Strahan, 2010)

Better

allocation of capital (Strahan &

Stiroh

, 2003)

More

economic dynamism (Kerr & Nanda, 2009)

Higher

overall growth (

Jayaratne

& Strahan, 1996)

Lower

volatility & better risk-sharing (Morgan et al (2004); Demyanyk et al (2007

))

Has the development of capital markets changed the picture?Slide3

Securitization → New Era of BankingSlide4

New Era of Banking?Slide5

High Level View on This PaperQuestions: Do branch networks still integrate the financial markets? What is the economic mechanism behind bank branches playing an important role?Mechanics:Look at the “anatomy” of

financial integration

through the prism of

the

“lending channel”

Exploit

exogenous idiosyncratic positive

shock to deposits stemming from fracking

Using data on bank-county-year lending activity, trace how this newly found liquidity is exported

Geographic markets: does branching matter?

Credit market segments: intensity of soft information productionSlide6

Can “Securitization” Fully Integrate Mortgage Markets?Arm’s length financing is powerful but limited in its reachlenders have better information than investorsincentives for lenders to screen & monitor sold loans

Gorton

and Pennacchi, 1995,

Holmstrom

and

Tirole

, 1997,

Keys et

al, 2010

;

Loutskina and Strahan

, 2011

Soft

information

production is still important in the mortgage market

Bank branches

Provide an

informational advantage

in local markets: Cortes, 2012

Mitigate contracting frictionsSlide7

This Paper: FindingsDo branch networks foster financial integration? YESExogenous liquidity shocks increase mortgage lending in counties connected via branch networks

Magnitudes are large, average shocked bank grows lending 7% more, relative to banks not exposed to shocks (sample average is 11%)

What types of loans are branch networks important for?

Credit

that is harder to securitize

Loans retained on the balance sheet increase

Purchase/HELOC increase, not refinancing (proxy for ability to sell)

Loans for borrowers that are close to lenders increase (proxy for information

)

Bank branches integrate credit markets unreachable by direct finance.Slide8

Shale Booms as a Natural ExperimentWhy is a shale discovery exogenous?

Shale discoveries are

Unexpected

Wealth windfalls

Deposit shocks and credit supply shocks Slide9

Shale Booms as a Natural ExperimentWhy is a shale discovery exogenous?Technological breakthroughs in 2002-2003: Horizontal Drilling and “Fracking”

Shale discoveries are

Unexpected

Wealth windfalls

Deposit shocks and

c

redit

s

upply shocks Slide10

Why are Shale Booms a good natural experiment?Why is a shale discovery exogenous?Technological breakthroughs in 2002-2003: Horizontal Drilling and “Fracking”

Chevron CEO John Watson: The

technological advances associated

with “fracking” took

the

industry “by surprise”

New Energy Supply =

42 Years of U.S. Gasoline consumption

Shale discoveries are

Unexpected

Wealth windfalls

Deposit shocks and credit supply shocks Slide11

Shale Booms as a Natural ExperimentUnique Dataset 16,731 individual shale wells

Time Period: 2000 – 2010

States with no home-market crashes

TX

LA

WV

PA

ND

AR

OK

Shale Discoveries are

Unexpected

Wealth windfalls

Deposit shocks and credit supply shocks Slide12

Shale Booms as a Natural ExperimentWealth windfallsDrilling rights must be leased, often from private individualsTerms: $30,000/acre Bonus + 25% RoyaltyExample: 1 square mile = $19.2 Million + 25% Royalty of gas

“I

got a check for over a million,

in

less than two

weeks”

- Mike Smith, Bossier City, Louisiana Mineral Owner

Increase in bank deposits and loan repayment

We have had depositors come in with more than a million dollars at a

whack”

-

H.B. “Trip”

Ruckman

III, President, The Karnes County National

Bank“Where we used to hunt for money, we don't have to hunt anymore.”

- Mike Wilson, President and CEO of Security State Bank, TexasSlide13

Bank-Specific Liquidity ShockMeasure Shale Booms With Unique DatasetSmith International Rig Count: All well drilling activity in the U.S.Bank Deposit and Branching Data

FDIC summary of Deposits

Bank

i

Exposure to the Boom (j sums across all counties)

 Slide14

Effect of Boom on DepositsUnit of Observation: Bank i, year t

 Slide15

Do Banks Chase Funds?

Unit of Observation: Bank

i,

year

t

 Slide16

Empirical Design

Boom County I

Non-booming County II

Bank A Branch

Bank A Lending

Bank B Lending

Shale Boom

$$

Saturate model with county-year

f

ixed effects

Compare lending behaviorSlide17

Effect of Shale Boom on Lending


Unit of observations: loan growth for bank

i

, county

j

, time

t

Economic Magnitude

Average exposed bank mortgages grow 7% faster (mean of 11%)

Average exposed bank retained mortgages grow 14% faster Slide18

Empirical Design

Boom County I

Non-booming County II

Bank A Branch

Bank A Lending

With

Branch

Bank B Lending

Shale Boom

$$

Saturate model with county-year

f

ixed effects

Compare lending behavior

Bank C Branch

Bank C Lending

NO

BranchSlide19

How Important is Local Branch Presence?


Economic Interpretation: Average exposed bank with local branch presence grows lending 10% faster (sample mean 11%)Slide20

Which Credit Market Segments Are Affected? 

Home Purchase

Mortgages

Home Equity Loans

Refinancings


Panel A of Table 7

(1)

(2)

(3)

Local-Lender Indicator

-0.0350**

-0.0372

-0.00673


(2.55)

(1.20)

(0.33)

Share of Branches in Boom

Counties

0.0626

-0.172

0.188*

(0.89)

(0.98

)

(1.91)

Share of Branches in Boom Counties

* Local-Lender Indicator

0.245**

0.592***

0.0642

(2.44)

(2.74)

(0.50)

Borrower & Lender controls

Yes

Yes

Yes

County*Year FE

Yes

Yes

Yes

Bank Clustered St Errors

Yes

Yes

Yes

Observations

64,860

34,839

66,237

R

2

9%

16%

15%

z-statistic for: (1)==(2)

(1.457)

z-statistic for: (2)==(3)

(2.099)

z-statistic for: (1)==(3)

(1.106)Slide21

Agency Problem? Do Banks Make Bad Loans?

Unit of Observation: Bank

i,

year

t

 Slide22

How are the funds being allocated?Un-served Demand & Bank Capital

Unit of observations: loan growth for bank

i

, county

j

, time

t

(local loans only)Slide23

ConclusionsBranch banking helps integrate credit marketsLiquidity windfalls increase lending if lender has branch in both areasEffect observed for harder-to-securitize categoriesEffects stronger when lagged acceptance rate is low and at bank less constrained by capitalProvides explanation of continued expansion of branch networks (in parallel with growth of securitization markets)

Provides explanation for why branch deregulation – by integrating credit markets - was so important!Slide24

ContributionFinancial integration literature:2 mechanisms behind effect of financial integrationEnhanced competition (… too many studies to cite)Capital can flow to markets with more projects and away from those with excess liquidity.The role of distance in lendingEffect on information production and monitoring

Petersen and

Rajan

, 2002,

Berger et al,

2005,

Degryse

and

Ongena

, 2005

;

Agrawal

and

Hauswald

,

2010Lender specializationLoutskina and

Strahan, 2011How bank liquidity shocks affect credit supplySchnabl, 2012, Paravisini,

2008, and othersSlide25

THANK YOU