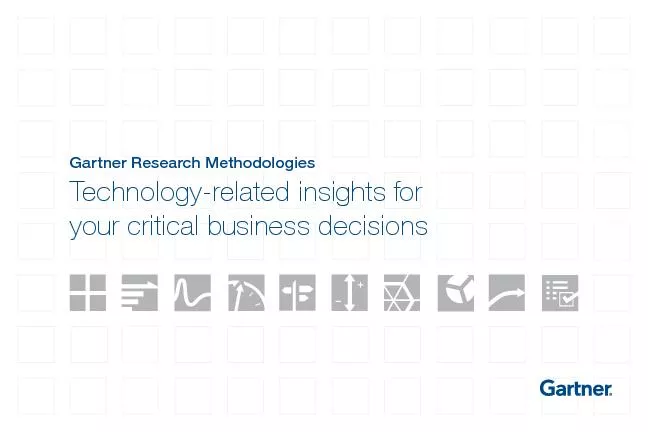
/
Gartner Research MethodologiesTechnology-related insights for your cri Gartner Research MethodologiesTechnology-related insights for your cri

Gartner Research MethodologiesTechnology-related insights for your cri - PDF document

alexa-scheidler
alexa-scheidler . @alexa-scheidler
Follow
445 views
Uploaded On 2016-06-26

Gartner Research MethodologiesTechnology-related insights for your cri - PPT Presentation

Why research matterscome 151 which is why you need clear reliable insights to help you fully succeed in your role What sets Gartner research apartInformation abounds but the real value comes fr ID: 378390

Why research matterscome which

Share:

Link:

Embed:

Download Presentation from below link

Download Pdf The PPT/PDF document "Gartner Research MethodologiesTechnology..." is the property of its rightful owner. Permission is granted to download and print the materials on this web site for personal, non-commercial use only, and to display it on your personal computer provided you do not modify the materials and that you retain all copyright notices contained in the materials. By downloading content from our website, you accept the terms of this agreement.


Presentation Transcript

Gartner Research Methodologies Technology-related insights for your critical business decisions Why research matters As digitalization continues to transform the way organizations do business, every technology decision becomes a business decision. The choices you make today can have lasting impact for years to come — which is why you need clear, reliable insights to help you fully succeed in your role. What sets Gartner research apart? Information abounds, but the real value comes from accurate interpretation and analysis. Whether you’re a technology executive, architect, investor or provider, Gartner gives you a comprehensive view of established and emerging markets so you can understand today’s landscape and plan for tomorrow’s. What this means for you • Global teams of seasoned, subject-matter experts • Rigorous, transparent, objective, collaborative results • Unmatched knowledge base • Actionable insight 1 Over 1,100 analysts worldwide Thousands of client organizations around the globe More than 240,000 client interactions each year Our research is unequivocal Rigorous. We are scrupulous in ensuring that the research practices we follow deliver insights that are relevant, appropriate and practical for your business. Systematic. Our process and methodologies follow a consistent, logical and considered sequence. We don’t take shortcuts; we develop solutions that work. Valid. Our opinions are grounded in a solid base of facts veried by our own experienced analysts and others in business and academia. Empirical. Our conclusions are based on the hard evidence we collect — through our analysts and market surveys — from the real-life experiences of our clients. Coverage you won’t nd anywhere else: 2 Our process: Turning complex information into actionable advice The Gartner research process involves input from a variety of market and client sources, enabling us to view technology topics from every angle. It is designed to accommodate change while considering topics that might not be obvious or mainstream. When a complex topic arises, analysts form a research community to discuss the subject and eliminate uncertainties. 3 Step Description Unique Value Scenarios We set our research objectives by asking questions such as, “What disruptions in technology will take place over the next ve to 10 years? What kind of impact will they have?” Because Gartner is independent and not tied to any predetermined outcome, we explore tough situations or outcomes that other rms might not want to approach. Surveys Once an objective is set, our analysts conduct formal and informal surveys of IT users, technology providers, investors, business people, academicians and other researchers. Our unmatched level of client exposure offers the broadest survey base available in the industry. Pattern Recognition By analyzing data from multiple sources, we identify emerging patterns within markets, modify assumptions and update the scenarios. Proprietary methodologies bring structure and standardization, enabling us to deliver a full, accurate picture. Stalking Horse A “stalking horse” is a position released into the analyst community to be examined and debated from divergent viewpoints. We adjust this position, test it and readjust it until it appears to be the strongest conclusion to offer clients. The unique size, scope and expertise of our analyst community ensure you get the most comprehensive analysis of every position. Search and Verify In this nal step, we validate our ndings against multiple internal and external sources and hold intense internal debates over the conclusions. Either we reach consensus or the position is discarded. Continual updating and validation ensure that the insights we generate keep pace with the rapid changes in business and technology. The ve-step Gartner research process These methodologies, based on repeatable, proven processes, prescribe logical steps that must be taken each and every time a methodology is executed. 4 Gartner Proprietary Methodologies The industry standard for measurement and analysis Magic Quadrant Critical Capabilities Hype Cycle IT Market Clock Market Guide Vendor Rating ITScore Market Share Market Forecast Evaluation Criteria Our methodologies help you discern crucial information from market noise so you can advance your initiatives and nd answers to your most important questions. Clients value the underlying methodologies of our research process because these methodologies bring simplicity to complex situations. The graphical summaries quickly inform and hasten decision cycles, helping you tackle complex decisions about IT investment priorities, the impact of globalization, the application of emerging technologies and other critical issues, with greater efciency and effectiveness. 5 A Gartner Magic Quadrant provides a graphical competitive positioning of technology providers in a specic market where market growth is high and provider differentiation is distinct. Magic Quadrants are a rst step to understanding the providers you should consider for a particular investment opportunity. • Map provider strengths and challenges against specic business requirements • Gauge providers’ ability to deliver on what you require today and in the future • Ascertain how well providers are executing against their stated visions • Compare how well they are performing against Gartner’s market view Contextualization enables you to view a Magic Quadrant through a specic lens, providing high-impact perspective by key industry, region and company size. This enhancement provides analyst commentary on the market and notable vendors from key client contexts. The interactive Magic Quadrant experience provides you a customized view of the market based on the criteria most important to you. Gartner Magic Quadrant Understand how providers are competitively positioned P 6 Gartner Critical Capabilities Explore vendor offerings more deeply Gartner Critical Capabilities completes your view of the market with deeper insight into vendors’ product or service offerings and how these rate against common client-usage scenarios. This essential companion to the Gartner Magic Quadrant enables you to: • Map provider strengths and challenges against specic business requirements • Gauge providers’ ability to deliver on what you require today and in the future • Quickly assess how well providers are executing against their stated visions The compelling interactive experience leverages the Interactive Magic Quadrant to help you: • Narrow down and focus on the product and service criteria most important to you • Create your own experience with customized use cases based on your unique needs and requirements • Easily integrate information into your workow and decision-making process, saving you time 7 Gartner Hype Cycle Reduce risk in your technology investment decisions A Gartner Hype Cycle provides a graphic representation of the maturity and adoption of a particular technology or application, helping you: • Time investment decisions for emerging technologies • Uncover the real drivers of what will make a new technology commercially rewarding • Balance business benets with associated risks 8 Gartner IT Market Clock Gain a full life cycle view of your technology assets A Gartner IT Market Clock is a decision framework that helps you evaluate and prioritize IT investments. • Identify which assets carry what opportunities and risks • Build technology road maps that support business plans • Justify replacement, upgrade or divestiture decisions 9 Gartner Market Guide View providers in early, mature and small markets The Gartner Market Guide highlights the trends, providers and signicant attributes of a very early, mature or smaller market, so you can: • Keep apprised of emerging trends, market dynamics and notable providers • Consider independent, objective perspectives as you develop technology and business strategies • Understand how the capabilities within a technology and services market align to your business objectives 10 Gartner Vendor Rating Synchronize provider offerings with your business strategy A Gartner Vendor Rating assesses a technology provider’s areas of strength — such as products, support, pricing, technology, strategy and nancials — and how they align with your business objectives for a balanced portfolio. • Manage provider portfolio risks while keeping an eye on up-and-coming players and alternate providers • Understand how providers’ products and services stack up and how they are positioned for long-term survival • Support key purchase, investment and renewal decisions W eakCautionVariablePositiveStrong 11 Gartner ITScore Measure IT maturity in the context of your business Gartner ITScore helps you quantify the maturity of both the IT organization (as a provider of technology) and the enterprise (as a consumer of technology). • Identify and remove constraints on IT’s ability to drive better business results • Compare maturity across IT disciplines, and leverage best practices • Provide an objective basis for cross-functional communication, collaboration and planning 12 Gartner Market Share Providing timely data to support your important business decisions Gartner Market Share shows clients how share is allocated among 1,200 technology providers in over 30 key markets. • Identify markets where providers have the opportunity to take additional market share • Understand how leading providers are competing for market share • Understand where and how you can take advantage of shifts in market share 13 Gartner Market Forecast See where your important markets are headed Our Market Forecasts use market models, which incorporate all the inuencing factors important in describing the structure and dynamics of a given technology market. • Identify changing market conditions, their impact on the market and the related assumptions • Understand potential market opportunities • Evaluate, formulate and validate business plans 14 Gartner Evaluation Criteria Find the right provider offering for your business A companion to the Magic Quadrant and Critical Capabilities, the Gartner Evaluation Criteria document provides a baseline set of standards to help you make successful product purchasing decisions. • Understand the criteria around features and functions of various products and services • Quickly determine which product or solution is right for your specic technical requirements • Jump-start your RFI, avoid risk and improve the quality of your RFP, acquisition and implementation processes How will methodologies help you decide? 16 Contextualized resources. Scalable data. Flexible delivery. All working together to guide your strategic technology decisions. Gartner methodologies provide a comprehensive body of knowledge to help you: • Inform your decisions • Build successful strategies • Make a business case for technology • Select the right vendors • Improve business and IT performance Share How will methodologies help you decide? A CIO in a large Danish Bank has a major technology investment to make. She wants to ensure the CFO approves her proposal to initiate an RFP. She uses the Gartner Magic Quadrant for her particular technology and shortlists ve vendors. After reviewing the accompanying contextual pieces on nance and Europe, she decides to remove one vendor from consideration, determining that its strategy will not support her initiative. Next, the CIO uses the Gartner Critical Capabilities methodology to assess the viability of the remaining vendors’ products for her particular use case. She is left with three suitable vendors to consider for her RFP. One of these providers is a megavendor, so she reviews the Vendor Rating to ensure alignment with her initiative strategy. She validates her thinking with a Gartner analyst, who recommends a fourth vendor from the Cool Vendors list. This vendor is newer to the market, but may emerge as a viable provider for the CIO. The CIO takes her customized Gartner reports to the CFO for review, knowing that her RFP will be directed to a solid list of vendors that she wants to engage with and that can provide the solution she requires. For more information, visit gartner.com/methodologies GARTNER HEADQUARTERS Corporate Headquarters 56 Top Gallant Road Stamford, CT 06902-7700 USA +1 203 964 0096 Europe Headquarters Tamesis The Glanty Egham Surrey, TW20 9AW UNITED KINGDOM +44 1784 431611 Asia/Pacic Headquarters Gartner Australasia Pty. Ltd. Level 9, 141 Walker Street North Sydney New South Wales 2060 AUSTRALIA +61 2 9459 4600 Japan Headquarters Gartner Japan, Ltd. Atago Green Hills MORI Tower, 5F 2-5-1 Atago, Minato-ku Tokyo 105-6205, JAPAN +81 3 6430 1800 Latin America Headquarters Gartner do Brasil Av. Das Nações Unidas 12.551, 25º andar World Trade Center, Brooklin Novo São Paulo 04573-903 BRAZIL + 55 11 3043 7544 © 2016 Gartner, Inc. and/or its afliates. All rights reserved. Gartner, Magic Quadrant, Hype Cycle and IT Market Clock are trademarks of Gartner, Inc. or its afliates. For more information, email info@gartner.com or visit gartner.com. Produced by Marketing Communications RECORPMETHBROC080116 PROVIDER AMARKET SHARE BY PROVIDERMARKET SHARE BY INDUSTRYMARKET SHARE BY REGIONPROVIDER BPROVIDER CINDUSTRY AINDUSTRY BINDUSTRY CREGION AREGION B REGION C PROVIDER AMARKET SHARE BY PROVIDERMARKET SHARE BY INDUSTRYMARKET SHARE BY REGIONPROVIDER BPROVIDER CINDUSTRY AINDUSTRY BINDUSTRY CREGION AREGION B REGION C