/
Introductory lectures 2: The Role and Structure of Science Introductory lectures 2: The Role and Structure of Science

Introductory lectures 2: The Role and Structure of Science - PowerPoint Presentation

alexa-scheidler
alexa-scheidler . @alexa-scheidler
Follow
389 views
Uploaded On 2016-11-13

Introductory lectures 2: The Role and Structure of Science - PPT Presentation

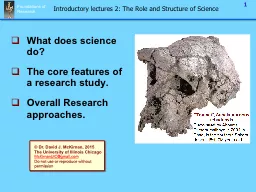
What does science do The core features of a research study Overall Research approaches Dr David J McKirnan 2015 The University of Illinois Chicago McKirnanUIC gmailcom Do not use or reproduce without permission ID: 488035

research theory amp hypothesis theory research hypothesis amp study results prediction data hypotheses methods test science experimental description control

Share:

Link:

Embed:

Download Presentation from below link

Download Presentation The PPT/PDF document "Introductory lectures 2: The Role and St..." is the property of its rightful owner. Permission is granted to download and print the materials on this web site for personal, non-commercial use only, and to display it on your personal computer provided you do not modify the materials and that you retain all copyright notices contained in the materials. By downloading content from our website, you accept the terms of this agreement.


Presentation Transcript

Slide1

Introductory lectures 2: The Role and Structure of Science

What does science do?The core features of a research study.Overall Research approaches.

© Dr

. David J.

McKirnan, 2015

The University of Illinois ChicagoMcKirnanUIC@gmail.comDo not use or reproduce without permissionSlide2

Introductory lectures 2: The Role and Structure of Science

What does science do?The core features of a research study.Overall Research approaches.

Slide3

What does science do?

What does Science do?Describe the worldMade predictions (hypotheses)Develop & test

theoriesApply findings or theories

Section OverviewSlide4

1. Describing the world

Simple observation: what goes on “in the wild”.Anthropology, sociology, ethnography, ethology….

Many quantitative studies begin with qualitative observations.

1. Qualitative Descriptio

n

Typically structured:field notes, checklists,

behavioral counts...Slide5

Describing the world

1. Qualitative Description

Focus groups, structured observations…

… valuable for

formulating hypotheses.

DescriptionPredictionTheoryApplicationSlide6

Science and description

World Music: A Retrospect Across The Globe, Venus Umesh. Link.Mathematics Describing the Real World: Pre-calculus and Trigonometry. Bruce

H. Edwards, link here.

D

escription … key building block in all areas…

DescriptionPredictionTheoryApplicationSlide7

Describing

the world Tracking behavior or systems using numbers

Useful for both developing and testing hypotheses.

Surveys, polls…

Archival data - uniform crime reports.

Physical observationsFrom: Climate Site; How do climate models work? Link.

2

. Quantitative Descriptio

n

Description

Prediction

Theory

ApplicationSlide8

Examples of Descriptive Research

Taxonomies: Classification systemsPaleontology; shared v. distinct evolutionary characteristics

Psychology, Psychiatry; behavioral patterns or disorders.

Demographics: ethnicity, socio-economic status, language group…

Description

PredictionTheoryApplicationSlide9

Taxonomies

: Classification systems

Look on the web site

 find out your personality ‘type’.

Description

Prediction

Theory

ApplicationSlide10

Examples of Descriptive Research

Where is AIDS most common in the U.S.?

Epidemiology

; Disease / behavior patterns in a population.

http://

filipspagnoli.wordpress.com/2011/11/17/human-rights-maps-160-gun-crime-in-the-u-s-in-2010/Distribution of gun assaults, by state.

Methods:

D

irect measurement

(e.g., surveys, disease reporting)

Standard records

(e.g., medical visits & diagnoses)

Archival data

(e.g., auto accident reports).

Description

Prediction

Theory

ApplicationSlide11

Descriptive research

Paleontology attempts to accurately describe the predecessors of humans to understand evolution

E X A M P L E

Carefully describing specimens and the conditions where they are

found can:

Produce insights into environmental change and evolutionAllow us to test hypotheses & develop theory.Description

Prediction

Theory

ApplicationSlide12

2. Science and Predictions

Practical applications: What

test score best predicts college success

?

 Can I predict which employees will steal?

These applications (should) stem from a theory.V

erbal & quantitative aptitude

academic success

A specific personality constellation

criminality…

That is

(or should be…)

supported by empirical

evidence

.Slide13

Science and Predictions

Practical applications:Testing hypotheses:

An hypothesis is a predictionCorrelational research;

I predict

: cultures undergoing rapid economic change will be more prone to irrational beliefs.

Experimental research; Lab: make Experimental group socially uncertain. Control: simple distraction.

I predict

: experimental group more prone toward superstitious beliefs.

Description

Prediction

Theory

ApplicationSlide14

3. Developing & Testing Theory

Identify basic (social, Ψ, physical…) processes…

that are systematically related…

Theory is the

‘bottom line’ of

science

t

hat show

how

or

why

something works.

i.e., what “causes” a phenomenon in the natural world.Slide15

Predictions and theory development

New data have led us to rethink basic theories of human evolution.From a simple progression……to a widening “bush” of parallel species.

E X A M P L E

Description

Prediction

Theory

ApplicationSlide16

Description

PredictionTheoryApplicationPredictions and theory development

As paleontologists rethink the shape of the evolutionary tree..They reconsider the basic

processes that shape human evolution.

E X A M P L ESlide17

Theory: Mediating variables

Mediating Variables: The core building blocks of theory,Basic physical, psychological or social processes,

Tell us how or why things work,H

elp us explain

our observations.Slide18

3. Testing theory: Mediating effects

Theory explains an observation or correlation by invoking a mediating variable.When are superstitions or irrational beliefs most common?A. We describe

a simple empirical effect (correlation):

Social & economic uncertainty

Irrational beliefs

Description

Prediction

Theory

Application

Historically,

superstitions are

prevalent during times of social & economic change.Slide19

3. Testing theory: Mediating effects

Need to feel control

Uncertainty

Irrational beliefs

Description

Prediction

Theory

Application

Uncertainty and irrational beliefs

A. We

describe

a simple empirical effect (correlation):

B. How does this work? What

Theory

(

ies

)

may explain this?

“Need for control” may

Mediate

the effect of uncertainty on irrational beliefs.

Social & economic uncertainty “causes”

people to seek a greater sense of personal control;

Need for perceived control can “cause” people to adopt superstitious beliefs.Slide20

3. Testing theory: Mediating effects

Need to feel control

Uncertainty

Irrational beliefs

Description

Prediction

Theory

Application

Uncertainty and irrational beliefs

How does this work? What

Theory

(

ies

)

may explain this?

“Need for control” is a core

Mediating Variable

in this theory.

It helps us

explain

how social & economic uncertainty may make people vulnerable to

superstitious beliefs.Slide21

3. Testing theory: Mediating effects

Need to feel control

Uncertainty

Irrational beliefs

Description

Prediction

Theory

Application

Uncertainty and irrational beliefs

How does this work? What

Theory

(

ies

)

may explain this?

Lessened Critical thinking

We may expand our theory:

Lessened critical thinking may also help

explain

the effect of uncertainty on beliefs.Slide22

3. Testing theory: Mediating effects

Need to feel control

Uncertainty

Irrational beliefs

Description

Prediction

Theory

Application

Uncertainty and irrational beliefs

How does this work? What

Theory

(

ies

)

may explain this?

Lessened Critical thinking

This theory is comprised of

two

Mediating

V

ariables

:

The combination of these variables may well

explain

the effect of uncertainty on beliefs.Slide23

Theory and process

Need to feel control

Uncertainty

Lessened Critical thinking

Irrational beliefs

Description

Prediction

Theory

Application

...identifies basic economic / psychological

processes

;

… is built of

mediating variables

;

…specifies how they may be

related

;

…generates testable

hypotheses.

Theory:

✓Slide24

Theory and process

Need to feel control

Uncertainty

Lessened Critical thinking

Irrational beliefs

Description

Prediction

Theory

Application

...identifies basic economic / psychological

processes

;

… is built of

mediating variables

;

…specifies how they may be

related

;

…generates testable

hypotheses

.

Theory:

I hypothesize that systems that introduce critical thinking in 1

o

and 2

o

school will have a lower prevalence of superstitious beliefs

.

I hypothesize that creating uncertainty in a lab will lessen participants’ ability to question their own assumptions and evaluate evidence

An hypothesis tested with a

correlational

design.

An hypothesis tested with an

experimental

design.Slide25

Educational theory:

Being active Cognitive “chunking”Multi-media 

attention

4.

Applications of theory

Use theory to design interventions…an intervention study can test a theory

Behavioral or biomedical interventions

compare treatments based on differing theories.

Design of this course

Description

Prediction

Theory

ApplicationSlide26

Theories and interventions

Smoking & social networks: people are influenced by their friends’ smoking

E X A M P L E

I

ntervention study

of

smoking

cessation:

quitting with friends may be more effective.

Description

Prediction

Theory

ApplicationSlide27

Theories and interventions

Theory: social networks  smoking.Hypothesis: network-based program would work better.

E X A M P L E

Pointed to a practical intervention approach;

S

upported the theory.

Testing the

hypothesis:

Description

Prediction

Theory

ApplicationSlide28

The values of science & empiricism

Empirical descriptionQualitative vs. quantitative…Developing hypotheses.Predictions

Core feature of a hypothesis;

Force us to clearly test our ideas.

Developing and testing theoryCentral to science; explain how a natural process works.

Applications of theoriesExpand and elaborate a theory.Advances in, e.g., technology, behavioral science

SUMMARYSlide29

Elements of science, review 1

Epidemiology is…A way of classifying people or behaviorsThe study of how frequent a behavior or “condition” is across a population.The identification of basic psychological principles that underlie important behaviorsA core feature of a hypothesis.Slide30

Elements of science, review 2

A Theory is…A way of classifying people or behaviorsThe study of how frequent a behavior or “condition” is across a population.The identification of basic psychological principles that underlie important behaviorsA core feature of an hypothesis.Slide31

Elements of science, review 2

A mediating variable is…A way of describing the world.An observed correlation.A psychological process that is the building block of a theory.A way of testing an hypothesis.Slide32

Elements of science, review 3

A Prediction is…A way of classifying people or behaviorsThe study of how frequent a behavior or “condition” is across a population.The identification of basic psychological principles that underlie important behaviorsA core feature of a hypothesis.Slide33

Elements of science, review 4

A Taxonomy is…A way of classifying people or behaviorsThe study of how frequent a behavior or “condition” is across a population.The identification of basic psychological principles that underlie important behaviorsA core feature of a hypothesis.Slide34

Introduction to science, 5

What does science do?Core features of a research study.Overall Research approaches.

Slide35

Section Overview

The overall “flow” of research

Phenomenon

- Larger

question the research addresses

Theory

-

E

xplanatory

processes & how they are related

Hypothesis

Concrete variables

Specific

prediction

Methods / Data

Operational definitions

Study procedures

Results

- Hypothesis-wise analysis

of

outcomes

Discussion & Conclusion

Relate results back to theory

Study limitations & Future studiesSlide36

Phenomenon

- Larger

question the research addresses

Theory

-

E

xplanatory

processes & how they are related

Hypothesis

Concrete variables

Specific

prediction

Methods / Data

Operational definitions

Study procedures

Results

- Hypothesis-wise analysis

of

outcomes

Discussion & Conclusion

Relate results back to theory

Study limitations & Future studies

Research Flow

What needs explaining?

Why is it important

?

How / why do I think it works?

What is my specific prediction?

What concrete evidence or data will I collect?

What was the outcome?

H

ypothesis supported?

What do the results mean for the theory?

What is unanswered?Slide37

Research Flow

Phenomenon

- Larger

question the research addresses

Theory

-

E

xplanatory

processes & how they are related

Hypothesis

Concrete variables

Specific

prediction

Methods / Data

Operational definitions

Study procedures

Results

- Hypothesis-wise analysis

of

outcomes

Discussion & Conclusion

Relate results back to theory

Study limitations & Future studies

The research flow begins with broad, abstract questions

G

ets more specific & concrete

Then back to a more general discussion.Slide38

Core features of research: Theory.

Phenomenon

- Larger

question the research addresses

Theory

-

E

xplanatory

processes & how they are related

Hypothesis

Concrete variables

Specific

prediction

Methods / Data

Operational definitions

Study procedures

Results

- Hypothesis-wise analysis

of

outcomes

Discussion & Conclusion

Relate results back to theory

Study limitations & Future studies

Abstract

statement of how

basic processes

relate to each other…

how

or

why

the

phenomenon “works.”

Theory:Slide39

B

asic physical or behavioral processes are the building blocks of theories.

Theory

Economic uncertainty

Cognitive style

StressGravityLearning…Slide40

Economic uncertainty

Cognitive styleStressGravityLearning…

They are abstract:

We cannot actually “see” gravity.

We just see what it does (stuff falls).

TheorySlide41

Economic uncertainty

Cognitive styleStressGravityLearning…

Gravity is a

Hypothetical Construct

:

Central to our understanding of nature.Abstract; we cannot measure it directly.

We measure and understand it by observing its effects on the world.

TheorySlide42

TheorySlide43

How do we use theory in research?

Test a theory:

Compare theories:

Extend an established theory:

Apply a theory:

Do

women who feel strong stereotype threat about math actually do worse

?

Which best explains women’s statistics performance: stereotype threat or social role learning?

Can

stereotype threat help us explain athletic as well as academic performance?

Can

I create instructions that relieve stereotype threat for women during

statistics

?Slide44

Core features of research: Hypotheses.

Phenomenon

- Larger

question the research addresses

Theory

- Basic

Ψ

processes we think explain the phenomenon

Hypothesis

Concrete variables

that express the

Ψ

processes

Specific prediction

Methods / Data

Operational definitions

Study procedures

Results

- Hypothesis-wise

statistical analysis of study outcomes

Discussion & Conclusion

Relate results back to theory

Study limitations & Future studies

A prediction

Derived from / testing the theory

That is potentially falsifiable.

Hypothesis

:Slide45

An hypothesis is a Prediction

Relating variables derived from the theory.Specifies cause and effect.…that is potentially falsifiable (see text for discussion)Can be conceivably / logically shown to be untrueSpecific enough to be tested

HypothesisSlide46

H

ypotheses

are expressed in

control

terms:

IF I make people relaxed

then

their fear and loathing of statistics will decrease.

Measurement studies

do not manipulate anything.

H

ypotheses are expressed as a

relation.

People who are high on a measurement of relaxation will tend to fear statistics less;

I predict a

correlation

between relaxation & fear of stats.

Hypotheses: Measurement v. Experimental studies

Hypothesis

In

experiments

we

manipulate

the

Independent Variable

.Slide47

Core features of research: Methods.

Phenomenon

- Larger

question the research addresses

Theory

- Basic

Ψ

processes we think explain the phenomenon

Hypothesis

Concrete variables

that express the

Ψ

processes

Specific prediction

Methods / Data

Operational definitions

Study procedures

Results

- Hypothesis-wise

statistical analysis of study outcomes

Discussion & Conclusion

Relate results back to theory

Study limitations & Future studies

We attempt to make each term of the study as objective as possible.

Both measurement & experimental procedures rely on

Operational Definitions

Methods:Slide48

Core element of scientific approachObjective

; designed to separate data from personPublic: multiple people participate in, challenge, or use scientific findingsReplicable: others can repeat or expand the study

T

urn our hypotheses into concrete

variables

That we examine via specific procedures

MethodsSlide49

We turn our hypotheses into variables via an

operation definition.Depression

“vegetative”; sleep, eating

Verbal behavior

Appearance

Suicidality, drug use, work…Survey / questionnaire answers…

What is “depression”?

What

operations

could assess it?

MethodsSlide50

Our

Operation definition determines what a variable “means” in our study.

What is “economic uncertainty”?

The unemployment rate?

Subjective attitude ratings?

What is “Stress”?Heart rate & cortisol levels?Speech patterns?MethodsSlide51

This is the

independent variable To test the hypothesis that stress impairs memory I may

create stress in the lab via…

Shock

.Requiring a difficult performance in front of others.

shock (a physical threat) and performance (a social threat)

Equivalent ‘Stressors”?

Are

MethodsSlide52

I may

measure stress levels in this class via:A questionnaire scaleHeart rate

Anxious behavior, sleep loss, appetite change…

Heart rate

and sleep lossEquivalent measures of Stress?

Are

MethodsSlide53

Operationalizing “Stress”

Does stress lead to illness?

E X A M P L E

“Stress”

“Illness”

Experimental designMeasurement study

Manipulate

the independent variable

Threatening information.

Shock.

Require difficult public performance.

Measure

the predictor

Questionnaire

scale on life events

Assess cardio-vascular reactivity

Measure

the dependent variable

Infection post-exposure

Observed respiratory infections

Measure

the outcome variable

Self-reported respiratory

infections

Morbidity & mortalitySlide54

Any theory must be operationalized to be heuristically useful

Operational definitions  real observable world. What does “stress” mean?

How will you measure it?

What does “health” mean?

How will you measure it?

T

hink critically

about what each variable means.

Methods: Why use Operational Definitions?

I think stress makes people less healthySlide55

Some variables are easy to operationalize; e.g., the effect of a drug dose on hypertension.

IV = drug dose1 v. drug dose 2 v. Placebo…DV = blood pressure.Some constructs can only be roughly operationalized.

“Pro-social attitude”, “self-concept”…

Some constructs have diverging operational definitions.

How do you operationally define “stress”?

…learning? Some domains may not be operationalizable.String theory… “Spirituality”? “Happiness”?Behavior?

Self-perception?

Physiological?

Methods: The limits of Operational DefinitionsSlide56

When am I dead?

Middle ages: the soul departs the body – weighs 21 gramsThe name:17th Century: Cordelia’s daughter in King Lear shows no breath on a mirror held to her nose

19th Century: Development of the stethoscope and “

heart death”.

Mid-20th Century: Development of respirators / life support and “brain death”.21

st Century: fMRI images show responsiveness even in some “vegetative” patients E X A M P L E

Physical death

Your body is consigned to the grave

Someone speaks your name the last time

When am I dead?

H

ow do we operationally define “death”?Slide57

Core features of research: Results.

Phenomenon

- Larger

question the research addresses

Theory

- Basic

Ψ

processes we think explain the phenomenon

Hypothesis

Concrete variables

that express the

Ψ

processes

Specific prediction

Methods / Data

Operational definitions

Study procedures

Results

- Hypothesis-wise

statistical analysis of study outcomes

Discussion & Conclusion

Relate results back to theory

Study limitations & Future studies

Qualitative

Quantitative

; statistical

reasoning

Results:Slide58

Two major streams:

Quantitative

research

 hypothesis tests

Numerical scales

Statistical reasoningQualitative research  rich descriptionText, Images, Video…

Results:Slide59

Quantitative

research.Numerical representation of realityDescriptive statistics

Simple characterization: “who / what / when?”Inferential statistics

Generalize to a larger population.

“Statistical reasoning”:

Probability judgments using the Normal distribution.Results:Slide60

Core features of research

Phenomenon

- Larger

question the research addresses

Theory

- Basic

Ψ

processes we think explain the phenomenon

Hypothesis

Concrete variables

that express the

Ψ

processes

Specific prediction

Methods / Data

Operational definitions

Study procedures

Results

- Hypothesis-wise

statistical analysis of study outcomes

Discussion & Conclusion

Relate results back to theory

Study limitations & Future studies

Implications for theory?

Study limitations?

Where now?

Discussion & Conclusions:Slide61

What does it mean that the hypothesis was (was not) supported?Change / modify theory?

Other interpretations / hypotheses?Applications?Study implications.

Discussion

Critical Thought

about the meaning – and alternate interpretations – of our results.Slide62

Study

limitations.Boundaries on what this study can tell us?Internal validity:Well did we represent the hypothetical constructs…?

Quality / nature of operationalization & design?External validity:

Our sample?

Manipulation / measurement of the independent variable(s)?Assessment of the dependent variable(s)?The research setting itself.

How representative was…DiscussionSlide63

What does science do?

Hypothetical constructs

In important relationship

S

pecific

variablesFalsifiable

prediction

Operational definition

Internal & external validity

Meaning of

results

for the

theory

Alternate interpretations

Study Limitations.

Qualitative

/ Quantitative

Descriptive question

or exploration

Hypothesis test

Phenomenon & Theory

Hypothesis

Methods

Results

Discussion

SUMMARYSlide64

Basic Elements of a Research Project

Methods

Measurement v.

experimental

Conclusions

Future research?PhenomenonBig picture / question

Theory

Hypothetical Constructs

Causal explanation

Hypothesis

Operational definition

Specific prediction

Data / Results

Descriptive data

Test hypothesis

Discussion

Implications for theory

S

pecific methods

& operational definitions

…derive concrete hypotheses.

A

ctual data & results…

… articulate a clear theory

Begin with the

“big question

…and larger

issues.

… implications for the theorySlide65

Basic Elements of a Research Project

MethodsMeasurement v.experimental

Each element of the project corresponds to a later / earlier issue…

Conclusions

Future research?

Phenomenon

Big picture /

question

Theory

Hypothetical Constructs

Causal explanation

Hypothesis

Operational definition

Specific prediction

Data / Results

Descriptive data

Test hypothesis

Discussion

Implications for theorySlide66

Basic Elements of a Research Project

Methods

Measurement v.

experimental

1

. Observation or hunch

Conclusions

Future research?

Phenomenon

Big picture /

question

Theory

Hypothetical Constructs

Causal explanation

Hypothesis

Operational definition

Specific prediction

Data

Descriptive data or observation

Discussion

Implications for theory

Study results often lead to the next experiment…

3. …explanation?

4.

T

heory

hypothesis

5. …how do we test or measure it?

2. …what don’t we understand?

Then we run the rest of the process

Data / Results

Descriptive data

Test hypothesis

Data / Results

Test

hypothesisSlide67

Basic Elements of a Research Project

Methods

Measurement v.

experimental

1. Alternate hypotheses?

Unanswered questions?

Conclusions

Future research?

Phenomenon

Big picture /

question

Theory

Hypothetical Constructs

Causal explanation

Hypothesis

Operational definition

Specific prediction

Results

Was the hypothesis supported?

Discussion

Implications for theory

R

esearch results

new experiment or study.

2

. Negative results:

Reframe hypothesis…

…operational

definitions

Data / Results

Descriptive data

Test hypothesis

Data / Results

Test new hypothesis

3

. Run follow-up study.Slide68

Basic Elements of a Research Project

Methods

Measurement v.experimental

1. Findings may lead us to rethink our theory.

Conclusions

Future research?PhenomenonBig picture / question

Theory

Hypothetical Constructs

Causal explanation

Hypothesis

Operational definition

Specific prediction

Discussion

Implications for theory

2

. We:

Formulate different hypotheses

D

ifferent study design & variables

New results

Results

Our initial findings

Data / Results

Descriptive data

Test hypothesis

Data / Results

Test new hypothesis

Results

Other findingsSlide69

Basic Elements of a Research Project

Methods

Measurement v.experimental

Key elements of research:

N

ot a simple linear process.All elements interact.ConclusionsFuture research?PhenomenonBig picture /

question

Theory

Hypothetical Constructs

Causal explanation

Hypothesis

Operational definition

Specific prediction

Discussion

Implications for theory

Data / Results

Descriptive data

Test hypothesisSlide70

Elements of science, review 1

A hypothetical construct is:A = A concrete description of a variableB = An abstract statement about a ψ process that cannot be seen directly.C = An excuse you construct to explain why you are late.D = An abstract use of statistical theory to test a hypothesis.Slide71

Elements of science, review 2

A theory is:A = Wild-eyed speculation about some topic that most people are not interested in.B = An authoritative statement of how something works: truth. C = Always tentative or provisional. D = A statement about how two (or more) hypothetical constructs are related.Slide72

Elements of science, review 3

An operational definition is:A = The specific way we manipulate an independent variable.B = A surgical procedure we use to test a hypothesis.C = The particular procedures we use to measure a study variable. D = An abstract statistical statement using probability theory to test hypotheses.Slide73

Elements of science, review 3

In science the numbers are what count most.Yes, if I have enough of themYes, if they have been operationally definedNo, the measures are most importantNo, the Theory and hypothesis is most important.Slide74

What does science do?

The core features of a research study.

Overall Research approaches.

Introduction to science, 6

Slide75

Overall research strategies

Observation or Measurement

Experiments

Simple Description

Correlational Studies

Quasi-experiments

“True” experiments

Qualitative

Quantitative

Measurement studies

vs.

Experiments

Slide76

Overall research strategies

Observation or Measurement

Experiments

Simple Description

Correlational Studies

Quasi-experiments

“True” experiments

Qualitative

Quantitative

A

ssess

nature

Describe behavior

T

est hypotheses

E

xert

control

over nature

T

est

experimental

predictions (hypotheses).Slide77

Overall research strategies

Observation or Measurement

Experiments

Simple Description

Correlational Studies

Quasi-experiments

“True” experiments

Qualitative

Quantitative

Rich / detailed

description.

Often targeted samples.

Count behaviors

e.g., by age

, gender,

ethnicity...

Archival

data

Measured variables

T

est or generate hypotheses.

N

atural events

Experiments:

N

o

control

over

IV

Non

-

equivalen

t

Groups

Manipulate

Independent Variabl

e

Measure

Dependent

Variable

.

Control

all aspects of experiment

Explore

behavior

.

Describe

trends.

Relate

variables

Field studies

C

ontrolled

(“lab”)

conditions.Slide78

Overall research strategies: Drug use

Observation or Measurement

Experiments

Simple Description

Correlational Studies

Quasi-experiments

“True” experiments

Qualitative

Quantitative

Methods:

Surveys, interviews

, archival

data

Show simple frequencies across, e.g., groups.

Methods

:

S

urveys

or

interviews

Archival data

Test hypotheses by correlating specific variables.

Methods

:

Experimental design.

Groups are

non-

equivalent

not

blind

not randomly

assigned…

Methods

:

Stimulate

contrasting brain

areas (IV

).

Assess drug

-

seeking (DV).

Methods:

Directly observe

drug

markets

,

In

-depth interviews

drug users,

Police…

Research Question

:

Mechanics of drug use.

Research Question

:

E

pidemiology

of drug

use.

Research Question:

S

ocial /

ψ

variables

in

drug use.

Research Question:

Compare drug treatments.

Research Question:

What brain centers control “drug craving”?Slide79

Experiments

Participant Selection

Group Assignment

Experimental Procedures

Experimental Condition

Results

Sample

Experimental group

Procedure

Experimental /“Treatment” condition

Outcome

Control

group

Procedure

Control / placebo condition

Outcome

Random

sample

of the target population.

Randomly assign

participants to groups.

E

xactly equal study procedures X groups.

Assess

Dependent Variable.

Controlled experiments:

G

old

standard” for testing

hypotheses.

Impose

experimental manipulation

Independent

Variable

.Slide80

Experiments

Participant Selection

Group Assignment

Experimental Procedures

Experimental Condition

Results

Sample

Experimental group

Procedure

Experimental /“Treatment” condition

Outcome

Control

group

Procedure

Control / placebo condition

Outcome

Random

sample

of the target population.

Randomly assign

participants to groups.

E

xactly equal study procedures X groups.

Assess

Dependent Variable.

Controlled experiments:

G

old

standard” for testing

hypotheses.

Impose

experimental manipulation

Independent

Variable

.

Random assignment

ensures

groups are equivalent at baseline

.

(Rather than, e.g., using existing groups

…)Slide81

Experiments

Participant Selection

Group Assignment

Experimental Procedures

Experimental Condition

Results

Sample

Experimental group

Procedure

Experimental /“Treatment” condition

Outcome

Control

group

Procedure

Control / placebo condition

Outcome

Random

sample

of the target population.

Randomly assign

participants to groups.

E

xactly equal study procedures X groups.

Assess

Dependent Variable.

Controlled experiments:

G

old

standard” for testing

hypotheses.

Impose

experimental manipulation

Independent

Variable

.

Experimental Control

ensures groups have the same procedures. Slide82

Experiments

Participant Selection

Group Assignment

Experimental Procedures

Experimental Condition

Results

Sample

Experimental group

Procedure

Experimental /“Treatment” condition

Outcome

Control

group

Procedure

Control / placebo condition

Outcome

Random

sample

of the target population.

Randomly assign

participants to groups.

E

xactly equal study procedures X groups.

Assess

Dependent Variable.

Controlled experiments:

G

old

standard” for testing

hypotheses.

Impose

experimental manipulation

Independent Variable

.

Manipulating the Independent Variable

ensures that we (the experimenter) cause the experimental effect. Slide83
Slide84

Often true experiments are not possible:

We must use existing groups

We cannot control all the procedures

We cannot manipulate the Independent Variable

….

Observation or Measurement

Experiments

Simple Description

Correlational Studies

Quasi-experiments

“True” experiments

Qualitative

Quantitative

Naturally

occurring

events;

Education

research;

Public health

research.

Examples:Slide85

Measurement v. experiments

ExperimentHigh control / ‘lab’ conditions

Internal

validity

Determine “cause and effect”: validly interpret data

Measurement

Less control; ‘

research in nature’

External

validity

Data can generalize to “real world” & capture more complexity

Observation or Measurement

Experiments

Simple Description

Correlational Studies

Quasi-experiments

“True” experiments

Qualitative

Quantitative

Explore

Describe

Relate measured variables

Field studies

.

Test specific hypotheses

Slide86

Less control:

Observe / test phenomenon under natural conditions.More accurate portrayal of:“how it works in nature”complexity of phenomenonLess able to interpret cause & effect

Overall Research strategies:

Validity

Observation or Measurement

Experiments

Simple Description

Correlational Studies

Quasi-experiments

“True” experiments

Qualitative

Quantitative

Explore

Describe

Relate measured variables

Field studies

.

Test specific hypotheses

External validity Internal validity

More control:

Isolate (or

create

)

the phenomenon

in a

controlled

environment

Addresses

specific

questions or hypotheses

More

able

to interpret cause & effectSlide87

OverviewSlide88

Core course topics

How do we know things?What does scientific method tell us that other methods (political, religious thought) do not?

What does science do?

Describe the world

TaxonomiesEpidemiology

Qualitative researchPredict eventsSimple predictionsCorrelational studiesExperiments

Test theories

Cause & effect

Identify basic processes

Show how processes are related

Test applications of theories

E.g., behavioral interventionsSlide89

key terms

Features of research: Key termsTheoryHypothetical constructHypothesisVariable

Operational definition

Experimental control

Measurement v. experimental studiesInternal & external validitySlide90

Basic Elements of a Research Project

MethodsMeasurement v.experimental

ConclusionsFuture research?

Phenomenon

Big picture /

question

Theory

Hypothetical Constructs

Causal explanation

Hypothesis

Operational definition

Specific prediction

Data / Results

Descriptive data

Test hypothesis

Discussion

Implications for theorySlide91

Basics of major forms of research.

Observation or Measurement

Experiments

Simple Description

Correlational Studies

Quasi-experiments

“True” experiments

Qualitative

Quantitative

Explore

the actual process of a behavior.

Describe

a behavioral or social trend.

Relate measured variables

to each other to test hypotheses.

Test hypotheses in

naturally occurring events

or

field studies

.

Test specific hypotheses

via controlled “lab” conditions.

External validity Internal validity