/
Sexually Transmitted Disease Sexually Transmitted Disease

Sexually Transmitted Disease - PowerPoint Presentation

alexa-scheidler
alexa-scheidler . @alexa-scheidler
Follow
345 views
Uploaded On 2019-11-19

Sexually Transmitted Disease - PPT Presentation

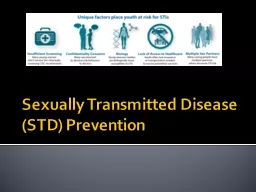
Sexually Transmitted Disease Surveillance 2018 Chlamydia Chlamydia Rates of Reported Cases by Sex United States 20002018 Per 100000 NOTE See sections A13 and A18 in the Appendix for more information on chlamydia case reporting and interpreting trends in chlamydia case reports ID: 765699

2018 chlamydia states united chlamydia 2018 united states reported sex rates cases 000 reporting 100 appendix note hispanic aged

Share:

Link:

Embed:

Download Presentation from below link

Download Presentation The PPT/PDF document "Sexually Transmitted Disease" is the property of its rightful owner. Permission is granted to download and print the materials on this web site for personal, non-commercial use only, and to display it on your personal computer provided you do not modify the materials and that you retain all copyright notices contained in the materials. By downloading content from our website, you accept the terms of this agreement.


Presentation Transcript

Sexually Transmitted Disease Surveillance 2018 Chlamydia

Chlamydia — Rates of Reported Cases by Sex, United States, 2000–2018 * Per 100,000.NOTE: See sections A1.3 and A1.8 in the Appendix for more information on chlamydia case reporting and interpreting trends in chlamydia case reports.

Chlamydia — Rates of Reported Cases by Region, United States, 2009–2018 * Per 100,000.

Chlamydia — Rates of Reported Cases by State and Territory, United States, 2018 * Per 100,000.NOTE: See Section A1.11 in the Appendix for more information on interpreting reported rates in US territories.

Chlamydia — Rates of Reported Cases by County, United States, 2018 * Per 100,000.NOTE: See section A1.5 in the Appendix for more information on county-level rates.

Chlamydia — Rates of Reported Cases by Age Group and Sex, United States, 2018 * Per 100,000.

Chlamydia — Rates of Reported Cases Among Females Aged 15–44 Years by Age Group, United States, 2009–2018 * Per 100,000.

Chlamydia — Rates of Reported Cases Among Males Aged 15–44 Years by Age Group, United States, 2009–2018 * Per 100,000.

Chlamydia — Rates of Reported Cases by Race/Hispanic Ethnicity, United States, 2014–2018 * Per 100,000.NOTE: See Section A1.5 in the Appendix for information on reporting STD case data for race/Hispanic ethnicity. ACRONYMS: AI/AN = American Indians/Alaska Natives; NHOPI = Native Hawaiians/Other Pacific Islanders.

Chlamydia — Percentage of Reported Cases Among Females by Reporting Source*, United States, 2009–2018 * See section A1.7 in the Appendix for information on classification of reporting sources and a full list of reporting sources.ACRONYMS: HMO = Health maintenance organization; HD = Health department.

Chlamydia — Percentage of Reported Cases Among Males by Reporting Source*, United States, 2009–2018 * See section A1.7 in the Appendix for information on classification of reporting sources and a full list of reporting sources.ACRONYMS: HMO = Health maintenance organization.

Chlamydia — National Estimates of Prevalence Among Persons Aged 14–39 Years by Sex, Race/Hispanic Ethnicity, or Age Group, National Health and Nutrition Examination Survey (NHANES), 2013–2016 NOTE: Error bars indicate 95% confidence intervals. Overall prevalence estimates include all race/Hispanic ethnicity groups, including those not shown separately.ADAPTED FROM: Torrone E, Papp J, Weinstock H. Prevalence of Chlamydia trachomatis genital infection among persons aged 14–39 years — United States, 2007–2012. MMWR Morb Mortal Wkly Rep. 2014;63(38):834–838.

Chlamydia — National Estimates of Prevalence Among Sexually-Active Females Aged 14–39 Years by Race/Hispanic Ethnicity and Age Group, National Health and Nutrition Examination Survey (NHANES), 2013–2016 NOTE: Error bars indicate 95% confidence intervals. Overall prevalence estimates include all race/Hispanic ethnicity groups, including those not shown separately.ADAPTED FROM: Torrone E, Papp J, Weinstock H. Prevalence of Chlamydia trachomatis genital infection among persons aged 14–39 years — United States, 2007–2012. MMWR Morb Mortal Wkly Rep. 2014;63(38):834–838.

Chlamydia — Proportion of STD Clinic Patients Testing Positive* by Age Group and Sex and Sex of Sex Partners, STD Surveillance Network (SSuN ), 2018* Results are based on unique patients with known sex of sex partners (n=83,691) attending SSuN STD clinics who were tested ≥1 time for chlamydia in 2018. NOTE: See Section A2.2 in the Appendix for SSuN methods. ACRONYMS: MSM = Gay, bisexual, and other men who have sex with men; MSW = Men who have sex with women only.