/
Spectral,             100 – 200+ bands Spectral,             100 – 200+ bands

Spectral, 100 – 200+ bands - PowerPoint Presentation

alexa-scheidler
alexa-scheidler . @alexa-scheidler
Follow
408 views
Uploaded On 2017-06-13

Spectral, 100 – 200+ bands - PPT Presentation

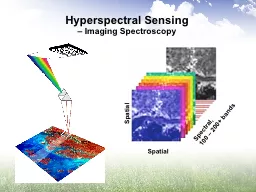
Spatial Spatial Hyperspectral Sensing Imaging Spectroscopy What is Hyperspectral Sensing Z Spectral Bands X Y Data Cube a way to visualize the data Multispectral Hyperspectral ID: 559204

hyperspectral reflectance data wavelength reflectance hyperspectral wavelength data bands sensing multispectral spectra spatial wide sensors image analysis identification diagnostic

Share:

Link:

Embed:

Download Presentation from below link

Download Presentation The PPT/PDF document "Spectral, 100 – 200+ bands" is the property of its rightful owner. Permission is granted to download and print the materials on this web site for personal, non-commercial use only, and to display it on your personal computer provided you do not modify the materials and that you retain all copyright notices contained in the materials. By downloading content from our website, you accept the terms of this agreement.


Presentation Transcript

Slide1

Spectral, 100 – 200+ bands

Spatial

Spatial

Hyperspectral Sensing

– Imaging SpectroscopySlide2

What is Hyperspectral Sensing?Slide3

Z = Spectral Bands

X

Y

Data Cube

– a way to visualize the dataSlide4

MultispectralHyperspectral

Reflectance

Wavelength

Wavelength

Continuous spectrum

Discrete bands

Reflectance

Each pixelSlide5

Multispectral vs. Hyperspectral Data

Wavelength

Reflectance

Multispectral,

e.g., Landsat TM

Hyperspectral,

e.g., AVIRISSlide6

Diagnostic / identifying characteristics are lost in wide bands

Spectra of two materials with (very) different reflectance and absorption properties.

If sensed with a wide band,

they will have the same response and cannot be discriminated or identified.

Wavelength

ReflectanceSlide7

Imaging Spectrometry ConceptSlide8

Wavelength

Reflectance

Analysis of Hyperspectral Data

-- Approaches

Direct identification using diagnostic absorption and reflection features

Comparison to laboratory and field measured spectra

Slide9

Crop Identification and Inventory

based solely on the spectraSlide10

Reflectance Spectra of Minerals

Wavelength,

μ

m

Relative ReflectanceSlide11

Mineral Detection and Mapping

Reflectance

Wavelength,

μ

mSlide12

True Color Image

Mineral Maps from Hyperspectral DataSlide13

University of Minnesota, Remote Sensing Lab and Water Resources Center

River Airborne

Hyperspectral Remote

Sensing

1.5

2

2.5

3

3.5

4

4.5

5

5.5

400

500

600

700

800

900

Wavelength (nm)

Reflectance %

Confluence of

Minnesota and

Mississippi

RiversSlide14
Slide15

Satellite Hyperspectral SensorsHyperion

On E0-1 (NASA) satellite

220 bands, 0.4 – 2.5 μm12-bit radiometric resolution30 m spatial resolution

7.5 km swath (= narrow)Slide16

SummaryHyperspectral sensing and analysis provides increased information compared to multispectral data

A fast growing technology - New sensors, new classification algorithms, and new image processing algorithms are being developed

Applications are being developed as the technology develops

Wavelength,

μm

Reflectance