PDF-Analysis of Tetrads from the yeast
Author : alida-meadow | Published Date : 2015-11-26
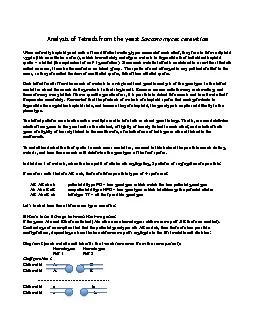
Saccaromyces cerevisiae When normally hap l oid yeast cells of two different mating types encounter each other they fuse to form a diploid zygote this constitutes
Presentation Embed Code
Download Presentation
Download Presentation The PPT/PDF document "Analysis of Tetrads from the yeast" is the property of its rightful owner. Permission is granted to download and print the materials on this website for personal, non-commercial use only, and to display it on your personal computer provided you do not modify the materials and that you retain all copyright notices contained in the materials. By downloading content from our website, you accept the terms of this agreement.
Analysis of Tetrads from the yeast: Transcript
Download Rules Of Document
"Analysis of Tetrads from the yeast"The content belongs to its owner. You may download and print it for personal use, without modification, and keep all copyright notices. By downloading, you agree to these terms.
Related Documents