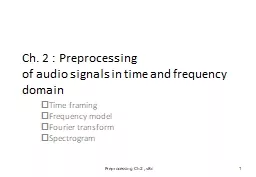
/
Ch. 2  : Preprocessing  of audio signals in time and frequency domain Ch. 2  : Preprocessing  of audio signals in time and frequency domain

Ch. 2 : Preprocessing of audio signals in time and frequency domain - PowerPoint Presentation

alida-meadow
alida-meadow . @alida-meadow
Follow
342 views
Uploaded On 2019-06-22

Ch. 2 : Preprocessing of audio signals in time and frequency domain - PPT Presentation

Time framing Frequency model Fourier transform Spectrogram Preprocessing Ch2 v8c 1 Revision Raw data and PCM Human listening range 20Hz 20K Hz CD HiFi quality music 441KHz sampling 16bit ID: 759670

Share:

Link:

Embed:

Download Presentation from below link

Download Presentation The PPT/PDF document "Ch. 2 : Preprocessing of audio signals..." is the property of its rightful owner. Permission is granted to download and print the materials on this web site for personal, non-commercial use only, and to display it on your personal computer provided you do not modify the materials and that you retain all copyright notices contained in the materials. By downloading content from our website, you accept the terms of this agreement.


Presentation Transcript

Slide1

Ch. 2 : Preprocessing of audio signals in time and frequency domain

Time framing Frequency modelFourier transformSpectrogram

Preprocessing Ch2 , v8c

1

Slide2

Revision: Raw data and PCM

Human listening range 20Hz  20K HzCD Hi-Fi quality music: 44.1KHz (sampling) 16bitPeople can understand human speech sampled at 5KHz or less, e.g. Telephone quality speech can be sampled at 8KHz using 8-bit data.Speech recognition systems normally use: 10~16KHz,12~16 bit.

Preprocessing Ch2 , v8c

2

Slide3

Concept: Human perceives data in blocks

We see 24 still pictures in one second, then we can build up the motion perception in our brain.It is likewise for speech

Preprocessing Ch2 , v8c

3

Source:

http://antoniopo.files.wordpress.com/2011/03/eadweard_muybridge_horse.jpg?w=733&h=538

Slide4

Time framing

Since our ear cannot response to very fast change of speech data content, we normally cut the speech data into frames before analysis. (similar to watch fast changing still pictures to perceive motion )Frame size is 10~30ms (1ms=10-3 seconds)Frames can be overlapped, normally the overlapping region ranges from 0 to 75% of the frame size . Time framing Video demo: https://youtu.be/lOu-c2UHU00

Preprocessing Ch2 , v8c

4

Slide5

Frame blocking and Windowing

To choose the frame size (N samples )and adjacent frames separated by m samples.I.e.. a 16KHz sampling signal, a 10ms window has N=160 samples, (non-overlap samples) m=40 samples

Preprocessing Ch2 , v8c

5

l=1 (first window), length = N

m

N

N

l

=2 (second window), length = N

n

s

n

time

Slide6

Tutorial for frame blocking

A signal is sampled at 12KHz, the frame size is chosen to be 20ms and adjacent frames are separated by 5ms. Calculate N and m and draw the frame blocking diagram.(ans: N=240, m=60.)Repeat above when adjacent frames do not overlap.(ans: N=240, m=240.)

Preprocessing Ch2 , v8c

6

Slide7

Class exercise 2.1

For a 22-KHz/16 bit sampling speech wave, frame size is 15 ms and frame overlapping period is 40 % of the frame size.Draw the frame blocking diagram.

Preprocessing Ch2 , v8c

7

Slide8

The frequency model

For a frame we can calculate its frequency content by Fourier Transform (FT)Computationally, you may use Discrete-FT (DFT) or Fast-FT (FFT) algorithms. FFT is popular because it is more efficient.FFT algorithms can be found in most numerical method textbooks/web pages.E.g. http://en.wikipedia.org/wiki/Fast_Fourier_transform

Preprocessing Ch2 , v8c

8

Slide9

A time domain signal of N samples

9

S

k

=0

S

k

=2

S=

Signal

level

Time

k

S

k

=1

k=0 1 2….

k=N-1

Preprocessing Ch2 , v8c

Slide10

The Fourier Transform FT method(see appendix of why mN/2)

Forward Transform (FT) of N sample data points

Preprocessing Ch2 , v8c

10

Demo

Matlab

code:

demo_dft_tutorial.rar

Slide11

Fourier Transform

Preprocessing Ch2 , v8c

11

Called spectral

envelop

S

0,S1,S2,S3. … SN-1

Time

Signal

voltage/

pressure

level

Fourier Transform

freq. (m)

single freq..

Power=

|

X

m

|= (real2+imginary2)

Demo

Matlab

code:

demo_dft_tutorial.rar

Demo Video

Slide12

Example

[s0,s1,s2,…]=[1 ,3 ,4,…], N=128, m=0,…,64Xm=0=1*e-j(2*pi*0*0/128)+3*e-j(2*pi*1*0/128)+4*e-j(2*pi*2*0/128) +..Xm=1=1*e-j(2*pi*0*1/128)+3*e-j(2*pi*1*1/128)+4*e-j(2*pi*2*1/128) +..Xm=2=1*e-j(2*pi*0*2/128)+3*e-j(2*pi*1*2/128)+4*e-j(2*pi*2*2/128) +..

Preprocessing Ch2 , v8c

12

Slide13

Examples of FT (Pure wave vs. speech wave)

Preprocessing Ch2 , v8c

13

time(k)

pure cosine has one frequency band

single freq..

|

X

m

|

s

k

complex speech wave

has many different frequency bands

s

k

time(k)

FT

freq.. (m)

freq. (m)

single freq..

|

X

m

|

Spectral envelop

http://

math.stackexchange.com/questions/1002/fourier-transform-for-dummies

DFT and Inverse: DFT https

://

www.mathworks.com/matlabcentral/fileexchange/41228-dft-and-idft/content/Untitled3.m

Slide14

Discrete Fourier transform DFT and Inverse Discrete Fourier transform IDFT

Preprocessing Ch2 , v8c

14

https://

en.wikipedia.org/wiki/Discrete_Fourier_transform

Matlab

code:

https

://

www.mathworks.com/matlabcentral/fileexchange/41228-dft-and-idft/content/Untitled3.m

Slide15

Use of short term Fourier Transform (Fourier Transform of a frame)

Power spectrum envelope is a plot of the energy Vs frequency.

Preprocessing Ch2 , v8c

15

DFT or FFT

Time domain signal

of a frame

Frequency

domain output

amplitude

time

freq..

Energy

Spectral envelop

time domain signal

of a frame

1

KHz

2

KHz

First formant

Second formant

FFT video demo:

https://youtu.be/EuX2uKZSd40

Slide16

Class exercise 2.2: Fourier Transform

Write pseudo code (or a C/matlab/octave program segment but not using a library function) to transform a signal in an array. Int s[256] into the frequency domain in float X[128+1] (real part result) and float IX[128+1] (imaginary result).How to generate a spectrogram?

Preprocessing Ch2 , v8c

16

Slide17

The spectrogram: to see the spectral envelope as time moves forward

It is a visualization method (tool) to look at the frequency content of a signal.Parameter setting: (1)Window size = N=(e.g. 512)= number of time samples for each Fourier Transform processing. (2) non-overlapping sample size D (e.g. 128). (3) frame index is j.t is an integer, initialize t=0, j=0. X-axis = time, Y-axis = freq.Step1: FT samples St+j*D to St+512+j*DStep2: plot FT result (freq v.s. energy) spectral envelope vertically using different gray scale.Step3: j=j+1Repeat Step1,2,3 until j*D+t+512 >length of the input signal.

Preprocessing Ch2 , v8c

17

Slide18

Preprocessing Ch2 , v8c

18

A specgram

Specgram: The

white bands

are the formants which represent high energy frequency contents of the speech signal

Slide19

Preprocessing Ch2 , v8c

19

Better time. resolution

Better frequency resolution

Freq.

Freq.

Slide20

Preprocessing Ch2 , v8c

20

How to generate a spectrogram?

Slide21

Preprocessing Ch2 , v8c

21

Procedures to generate a spectrogram (Specgram1)Window=256-> each frame has 256 samplesSampling is fs=22050, so maximum frequency is 22050/2=11025 HzNonverlap =window*0.95=256*.95=243 , overlap is small (overlapping =256-243=13 samples)

For each frame (256 samples)Find the magnitude of FourierX_magnitude(m), m=0,1,2, 128 Plot X_magnitude(m)= Vertically, -m is the vertical axis-|X(m)|=X_magnitude(m) is represented by intensityRepeat above for all framesq=1,2,..Q

|X(0)|

|X(i)|

|X(128)|

Frame q=1

Frame q=Q

frame q=2

Slide22

Class exercise 2.3: In specgram1

Calculate the first sample location and last sample location of the frames q=3 and 7. Note: N=256, m=243Answer: q=1, frame starts at sample index =?q=1, frame ends at sample index =?q=2, frame starts at sample index =? q=2, frame ends at sample index =?q=3, frame starts at sample index =? q=3, frame ends at sample index =? q=7, frame starts at sample index =?q=7, frame ends at sample index =?

Preprocessing Ch2 , v8c

22

Slide23

Spectrogram plots of some music soundssound file is tz1.wav

Preprocessing Ch2 , v8c

23

High

energy Bands:Formants

seconds

Matlab

Code:

demo_spectrogram_release16.rar

Slide24

spectrogram plots of some music sounds

Spectrogram ofTrumpet.wavSpectrogram ofViolin3.wav

Preprocessing Ch2 , v8c

24

High

energy

Bands:Formants

Violin has

complex

spectrum

seconds

http://www.cse.cuhk.edu.hk/%7Ekhwong/www2/cmsc5707/tz1.wav

http://www.cse.cuhk.edu.hk/~khwong/www2/cmsc5707/trumpet.wav

http://www.cse.cuhk.edu.hk/%7Ekhwong/www2/cmsc5707/v

iolin3.wav

Slide25

Exercise 2.4

Write the procedures for generating a spectrogram from a source signal X.

Preprocessing Ch2 , v8c

25

Slide26

Summary

StudiedBasic digital audio recording systemsSpeech recognition system applications and classificationsFourier analysis and spectrogram

Preprocessing Ch2 , v8c

26

Slide27

Appendix

Preprocessing Ch2 , v8c

27

Slide28

Answer: Class exercise 2.1

For a 22-KHz/16 bit sampling speech wave, frame size is 15 ms and frame overlapping period is 40 % of the frame size. Draw the frame block diagram.Answer: Number of samples in one frame (N)= 15 ms / (1/22k) = 15*(10^-3) /(1/(22000))=330 Overlapping samples = 132, m=N-132=198.Overlapping time = 132 * (1/22k)= 132 * (1/22000) =6ms; Time in one frame= 330* (1/22k)= 330* (1/22000)=15ms.

Preprocessing Ch2 , v8c

28

l

=1 (first window), length = N

m

N

N

l

=2 (second window), length = N

n

s

n

time

Slide29

Answer Class exercise 2.2: Fourier Transform

For (m=0;m<=N/2;m++){tmp_real=0; tmp_img=0;For(k=0;k<=N-1;k++){ tmp_real=tmp_real+Sk*cos(2*pi*k*m/N);tmp_img=tmp_img-Sk*sin(2*pi*k*m/N);}X_real(m)=tmp_real;X_img(m)=tmp_img;} From N input data Sk=0,1,2,3..N-1, there will be 2*(N+1) data generated, i.e. X_real(m), X_img(m), m=0,1,2,3..N/2 are generated.E.g. Sk=S0,S1,..,S511  X_real0,X_real1,..,X_real256, X_imgl0,X_img1,..,X_img256,Note that X_magnitude(m)= sqrt[X_real(m)2+ X_img(m)2]

Preprocessing Ch2 , v8c

29

http://en.wikipedia.org/wiki/List_of_trigonometric_identities

Slide30

Answer: Class exercise 2.3: In specgram1 (updated)

Calculate the first sample location and last sample location of the frames q=3 and 7. Note: N=256, m=243Answer: q=1, frame starts at sample index =0q=1, frame ends at sample index =255q=2, frame starts at sample index =0+243=243 (so the gap between the q=1 frame and q=2 frame is 243)q=2, frame ends at sample index =243+(N-1)=243+255=498 (so q=2 frame has 256 samples)q=3, frame starts at sample index =0+243+243=486q=3, frame ends at sample index =486+(N-1)=486+255=741q=7, frame starts at sample index =243*6=1458q=7, frame ends at sample index =1458+(N-1)=1458+255=1713

Preprocessing Ch2 , v8c

30

Slide31

Why in Discrete Fourier transform the summation is from k=0 to k=N-1 and m is ranging from 0 to N/2?

Since , Fourier frequency  real-value outputs  are mirrored around the vertical axis at 0, so using half are fine for calculating the energy during the calculation of the spectrum. It is only an engineering approach to save time. In fact the real definition is  using N sample for forward and inverse Fourier transform where all complex numbers are used.The problem is actual very deep mathematically, ie, how many samples should we use in forward and reverse transform. To get the best result, one should add more zeros to the original sequence (zero padding at the end of the sequence) to increase frequency resolution.x =     1     2     4     6     5     4     3>> fft(x),   Columns 1 through 4  25.0000 + 0.0000i  -7.5734 + 0.3479i  -0.4620 + 1.7568i  -0.9647 - 0.5410i  -0.9647 + 0.5410i  -0.4620 - 1.7568i  -7.5734 - 0.3479i

Preprocessing Ch2 , v8c

31

Antilasing

Demo

:

https://

www.youtube.com/watch?v=ByTsISFXUoY

https://

www.youtube.com/watch?v=Fy9dJgGCWZI

Slide32

Answer: Exercise 2.4

Write the procedures for generating a spectrogram from a source signal X.Answer: to be completed by students

Preprocessing Ch2 , v8c

32