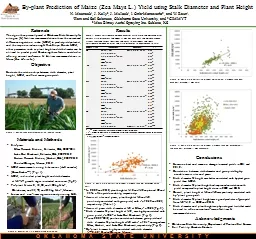
/
Plant-based Monitoring for Yield Prediction of Citrus under Plant-based Monitoring for Yield Prediction of Citrus under

Plant-based Monitoring for Yield Prediction of Citrus under - PowerPoint Presentation

alida-meadow
alida-meadow . @alida-meadow
Follow
344 views
Uploaded On 2019-11-01

Plant-based Monitoring for Yield Prediction of Citrus under - PPT Presentation

Plantbased Monitoring for Yield Prediction of Citrus under Differential Irrigation Dr P Panigrahi Scientist SS Directorate of Water Management Bhubaneswar Odisha India I ntroduction ID: 761723

water leaf nsns0 prd leaf water prd nsns0 irrigation 2011 2010 yield fruit 100 treatments index wbi rlwc kinnow

Share:

Link:

Embed:

Download Presentation from below link

Download Presentation The PPT/PDF document "Plant-based Monitoring for Yield Predict..." is the property of its rightful owner. Permission is granted to download and print the materials on this web site for personal, non-commercial use only, and to display it on your personal computer provided you do not modify the materials and that you retain all copyright notices contained in the materials. By downloading content from our website, you accept the terms of this agreement.


Presentation Transcript

Plant-based Monitoring for Yield Prediction of Citrus under Differential Irrigation Dr P. Panigrahi Scientist ‘SS ’ Directorate of Water Management, Bhubaneswar, Odisha, India

I ntroduction Water is the major constraint to crop production in many parts of the world. To sustain crop production in water scarce environments, deficit irrigation (DI) is a suggestable irrigation practice. DI is an irrigation strategy in which water is applied less than the full water requirement of the crop . Citrus, the third important fruit crop in India, has low productivity and it varies widely from year to year depending upon climate and water availability in different regions of the country. In changing climate scenario, it is utmost essential to optimize water management and prediction of yield of the crop.

DI 50: Irrigation at 50% ETc DI 75 : Irrigation at 75% ETc PRD50: Irrigation at 50% ETc through PRD PRD75: Irrigation at 75% ETc through PRDFI : Irrigation at 100% ETc throughout the crop period Treatment details of sustained deficit irrigation (DI) and Partial root zone drying (PRD) irrigation Scheduling Replication: 4; Plants per replication: 2; Design: RBD

1.2 m 1.0 m 0.9 m Tree stem Lateral pipe Drip emitter Wetted zone of emitter Micro tube Layout of drip emitters in tree basin and their wetted zone under PRD

The water application for fully-irrigated trees was computed as: ETc = Kp x Kc x Ep The volume of water applied under 100% ETc was estimated based on the formula (Germanà et al., 1992): Vid = π (D 2 / 4)  (ET c – R e ) / E i Irrigation water quantity estimation

Measurements and analysis Soil water measurement Leaf and stem water potential measurement For Relative leaf water content Leaf physiological parameters

Canopy reflectance Root sampling and analysis

Mature Kinnow fruits on trees Harvested Kinnow fruits Juice of Kinnow Analysis of Juice

The water stress integral ( Sψ) for each treatment was calculated using the midday leaf and xylem water potential data, according to the equation defined by Myers (1988): S ψ = where Sψ is water stress integral (MPa day), ψ i, i+1 is average midday leaf/stem water potential for any interval i and i+1 (MPa), c is maximum leaf/stem water potential measured during the study and n is number of days in the interval.2. a. Relative leaf water content (RLWC )was determined by the formula (Bowman, 1989):RLWC (%) = {(FW - DW) / (TW - DW)} x 100 b. Leaf water concentration (LWC) was determined using the formula (Peñuelas et al., 1997): LWC = {(FW−DW) / (FW)} x 100 Indices

3. The spectral reflectance indices related to water deficit conditions are calculated as: Water band index (WBI) = (R900) / (R970) (Penuelas et al., 1995); Normalized Difference water index (NDWI) = (R 857 – R1241) / (R857 + R1241) (Gao, 1995);Moisture stress index (MSI) = (R1599) / (R819) (Hunt et al., 1989); Normalised difference infrared index (NDII) = (R819-R1649) / (R819+R1649) (Jackson et al., 2004), Simple ratio (proposed) = (R1360) / (R 2250) where R and the subscript numbers indicate the light reflectance at the specific wavelength (in nm).

Treatments 2010 2011 N P K N P K DI 50 2.31a 0.15a 1.42a 2.43a 0.16a 1.44a DI 75 2.46a 0.19a 1.54b 2.46b 0.19a 1.56c PRD 50 2.35a 0.18a 1.48c 2.45b 0.18a 1.49d PRD 75 2.47b 0.21a 1.59a 2.49c 0.19a 1.61b FI 100 2.69c 0.22a 1.64c 2.72d 0.20a 1.66d Total N, P and K in leaf (%, dry weight basis) of ‘Kinnow’ mandarin as affected by various irrigation treatments Optimum range of leaf-N (2.28–2.53%), P (0.10–0.13% ), and K (1.28–1.63% ) for Kinnow (Hundal and Arora, 2001; Srivastava, 2011).

Treatments 2010 2011 Fe Mn Cu Zn Fe Mn Cu Zn DI 50 54.0a 48.6a 7.3a 24.7a 56.8a 50.3a 7.8a 24.9a DI 75 58.4a 57.8a 7.9a 25.6a 58.7a 58.2a 8.2a 24.1a PRD 50 55.6a 51.2a 7.3a 25.2a 56.7a 51.8a 7.9a 25.5a PRD 75 59.9a 58.4a 8.2a 25.8a 61.4a 58.9a 8.4a 26.9a FI 100 62.6b 61.5b 8.2a 26.9b 62.8b 61.6a 8.9a 27.2b Total Fe, Mn, Cu and Zn in leafs (ppm, dry weight basis of ‘Kinnow’ mandarin as affected by various irrigation treatments Optimum values (62.3–89.4 ppm Fe, 58.7 – 76.3 ppm Mn, 8.1 – 10.3 ppm Cu and 26.3 – 28.5 ppm Zn) of Kinnow mandarin (Hundal and Arora, 2001; Srivastava, 2011).

Leaf/stem water potential and leaf /stem water stress integral during 2010 and 2011

RLWC and LWC in 2010 1nd 2011

Treatments 2010 2011 Pn gs Tr LWUE Pn gs Tr LWUE DI 50 2.89a 21.07b 1.66b 1.74c 2.94a 20.50b 1.53b 1.92a DI 75 2.92a 24.80d 1.84d 1.58a 3.41b 23.48d 1.60d 2.13b PRD 50 2.90a 20.13a 1.43a 2.02e 3.38b 20.04a 1.31a 2.58d PRD 75 2.95b 23.13c 1.79c 1.65b 3.45b 22.83c 1.57c 2.17b FI 100 3.88c 37.78e 2.08 1.86d 4.37c 31.07e 1.74e 2.51c Leaf physiological parameters under different irrigation treatments in 2010 and 2011

Treatments 2010 2011 TH SD CD CV TH SD CD CV DI 50 33.4a 20.4a 25.8a 0.81a 21.7a 19.2a 20.1a 0.64a DI 75 36.2b 22.5b 31.3b 0.83a 26.7b 20.9b 27.5b 0.77a PRD 50 32.5a 19.7a 25.3a 0.79a 21.0a 19.0a 18.8a 0.60a PRD 75 35.9b 22.0b 30.9b 0.80a 26.5b 20.9b 26.9b 0.74a FI 100 40.7c 26.2c 48.7c 0.86b 36.0c 25.6c 32.3c 0.98b Tree growth under various irrigation treatment

Treatments Hyperspectral Indices 2010 2011 WBI NDWI MSI NDII SR WBI NDWI MSI NDII SR DI 50 1.056 0.042 0.561 0.266 3.002 0.992 0.081 0.462 0.219 2.937 DI 75 0.966 0.035 0.472 0.243 2.802 0.981 0.064 0.417 0.206 2.811 PRD 50 1.006 0.037 0.481 0.251 2.862 0.984 0.076 0.431 0.207 2.828 PRD 75 0.932 0.034 0.471 0.241 2.847 0.952 0.057 0.406 0.205 2.796 FI 100 0.917 0.033 0.469 0.239 2.711 0.815 0.031 0.384 0.203 2.629 Mean water band index (WBI), normalised difference water index (NDWI), moisture stress index (MSI) and Normalised difference infrared index (NDII) of Kinnow mandarin under various irrigation treatments . Parameters are significantly different from each other

Treatments 2010 No. fruits dropped/tree No. fruits harvested/tree Average fruit weight (g) Fruit yield (t ha -1 ) IWUE (t ha -1 mm -1 ) WUE (t ha -1 mm -1 ) DI 50 170 d (96 * , 52 ** , 22 *** ) 671a 152.7a 51.23a 0.108c 0.056c DI 75 135c (77, 40, 18) 718b 161.6b 58.01c 0.081b 0.051b PRD 50 148b (80, 48, 20) 703b 160.7b 56.48b (8.7%) 0.119d (83%) 0.062c PRD 75 100a (61, 28, 11) 755c 163.0b 58.73c 0.082b 0.053b FI 100 92 a (64, 15, 13) 763c 162.3b 61.91d 0.065a 0.047a Fruit yield, IWUE, and WUE in 2010

Treatments 2011 No. fruits dropped/tree No. fruits harvested/ tree Average fruit weight (g) Fruit yield (t ha -1 ) IWUE (t ha -1 mm -1 ) WUE (t ha -1 mm -1 ) DI 50 151e (82 * , 50 ** , 19) 682a 154.7a 52.75a 0.150c 0.071c DI 75 109c (66, 32 , 11) 739c 163.1b 60.26c 0.114b 0.067b PRD 50 126d (70 , 46 , 10) 711b 161.0b 57.23b (9.4%) 0.163d (81%) 0.077 d PRD 75 89b (52, 27 , 10) 751c 165.2 b 62.03c 0.118b 0.070c FI 100 79a (51 , 20 , 8) 776d 162.8b 63.20c 0.090a 0.061a Fruit yield, IWUE, and WUE in 2011

Treatments 2010 Juice content (%) TSS ( 0 Brix) TA (%) Ascorbic acid (mg/l) Reducing Sugar (mg/l) Total Sugar (mg/l) DI 50 43.7a 11.4 1.02f 120.4a 50.4c 73.8c DI 75 46.7b 10.9c 0.82b 112.1a 42.9b 61.7a PRD 50 45.5b 11.2b 0.84b 119.8a 59.3d 67.4b PRD 75 48.2b 10.8b 0.82b 109.0c 47.1c 60.1a FI 100 49.6c 10.8c 0.81b 116.3b 37.2a 66.4b Fruit quality parameters of Kinnow fruits in 2010

Treatments 2011 Juice content (%) TSS ( 0 Brix) TA (%) Ascorbic acid (mg/l) Reducible sugar (mg/l) Total sugar (mg/l) DI 50 43.1a 11.7 a 0.96f 128.7a 54.7c 75.4c DI 75 45.9b 11.2c 0.80d 114.7a 45.9b 64.7a PRD 50 44.3b 11.4b 0.83e 123.6a 61.7d 69.3b PRD 75 47.9b 11.1b 0.80b 111.9c 49.2b 63.2a FI 100 49.5c 10.9c 0.79b 119.1b 38.7a 68.7b Fruit quality parameters of Kinnow fruits in 2011

Parameters Fruit Yield SD CV Leaf-N Leaf-K Leaf- Fe Leaf- Zn SΨ l SΨ s RLWC LWC Pn Tr gs LWUE WBI NDWI MSI SD 0.25 * CV 0.33 * 0.69 * Leaf-N 0.57 + NS 0.29 * Leaf-K 0.61 + NS 0.41 * 0.43 * Leaf- Fe NS NS NS NS NS Leaf-Zn 0.58 * NS NS NS NS 0.41 * SΨ l 0.59 + 0.21 * 0.29 * 0.43 * 0.47 * NS NS SΨ s 0.62 + 0.26 * 0.32 * 0.52 * 0.49 * NS NS 0.93 + RLWC 0.55 + 0.20 * 0.17 * 0.32 0.32 * NS NS 0.74 + 0.79 + LWC 0.53 + NS NS 0.300.25*NSNS0.59+0.69+0.74+Pn0.55+NS0.23*0.85+0.44*0.78+0.360.62+0.53+0.66+0.55+Tr0.51+NSNS0.69*0.51+0.43*0.290.78+0.83+0.71+0.69+0.61+gs0.61+NSNS0.58*0.55+0.45*0.380.79+0.76+0.75+0.66+0.58+0.61+LWUE0.60+NSNS0.47*0.36*0.42*0.210.73+0.69+0.59+0.48+0.39+0.69+0.57*WBI0.57+0.29*0.29*0.59+0.47*0.44*NS0.65+0.67+0.69+0.52+0.47*0.55*0.51*0.30+NDWI0.53*NSNS0.53*NSNSNS0.38*0.48*0.57*0.40*0.33*0.49*0.40*0.21*0.59+MSI0.79+0.22*0.23*0.51+0.40*NSNS0.44*0.41+0.52+0.47+0.42+0.43+0.45*0.17+0.59*0.54*NDII0.49*NSNS0.43*0.36*0.27*NS0.26*0.32*0.47*0.49*0.39*0.37+0.39*0.26*0.55*0.48*0.51*SR0.61+NSNS0.54+0.36*NSNS0.57+0.62+0.63+0.58+0.47+0.50+0.44*0.20*0.84+0.59*0.60* Correlation matrix (Pearson’s) for plant-based observations during 2010 and 2011 under DI

Parameters Fruit Yield SD CV Leaf-N Leaf-K Leaf- Fe Leaf- Zn SΨ l SΨ s RLWC LWC Pn Tr gs LWUE WBI NDWI MSI SD 0.19 * CV 0.27 * 0.59 * Leaf-N 0.59 + NS 0.23 * Leaf-K 0.62 + NS 0.30 * 0.21 * Leaf- Fe NS NS NS NS NS Leaf-Zn 0.58 * NS NS NS NS 0.33 * SΨ l 0.63 + 0.27 * 0.19 * 0.38 * 0.40 * NS NS SΨ s 0.69 + 0.29 * 0.22 * 0.42 * 0.49 * NS NS 0.91 + RLWC 0.55 + 0.20 * 0.16 * 0.22 0.33 * NS NS 0.70 + 0.87 + LWC 0.51 + NS NS 0.290.24*NSNS0.63+0.65+0.87+Pn0.59+NS0.20*0.84+0.40*0.74+0.310.54+0.55+0.60+0.50+Tr0.57+NSNS0.61*0.48+0.38*0.270.80+0.80+0.77+0.66+0.59+gs0.44+NSNS0.52*0.50+0.40*0.330.82+0.82+0.68+0.60+0.75+0.75+LWUE0.60+NSNS0.38*0.33*0.40*0.280.74+0.67+0.50+0.49+0.37+0.64+0.59*WBI0.50#0.21*0.27*0.58+0.42*0.42*NS0.69+0.65+0.66+0.52+0.44*0.55*0.50*0.32+NDWI0.49*NSNS0.50*NSNSNS0.37*0.44*0.59*0.40*0.34*0.44*0.43*0.17*0.55+MSI0.59+0.15*0.11*0.51+0.41*NSNS0.46*0.35+0.38+0.47+0.42+0.42+0.47*0.19+0.73*0.50*NDII0.40*NSNS0.43*0.39*0.21*NS0.28*0.33*0.42*0.46*0.30*0.32+0.30*0.29*0.57*0.61*0.49*SR0.64+NSNS0.54+0.37*NSNS0.59+0.59+0.64+0.59+0.44+0.51+0.40*0.22*0.81+0.74*0.63* Correlation matrix (Pearson’s) for plant-based observations during 2010 and 2011 under PRD

PC DI PRD Variables Eigen value % variance Cumulative % of variance Variables Eigen value % variance Cumulative % of variance 1 SΨ s , Leaf-N, Leaf-K, SΨ l , RLWC 6.964 40.20 40.20 SΨ s , Leaf-N, Leaf-K, SΨ l , RLWC 5.744 38.46 38.46 2 gs, Pn 3.716 33.54 73.74 gs, Pn 2.899 32.11 70.57 3 WBI, SR 2.449 15.28 89.02 WBI, SR 2.219 13.77 84.34 Principal components with Eigen values and variances

( i) For DI: Fruit yield = -0.957 (Leaf-N) + 42.441 (Leaf-K) – 0.275 (SΨ s) + 0.138 (gs) + 17.510 (WBI) – 17.630 (P < 0.05; R2 = 0.98; RMSE = 0.30%) (for 2010)(ii) For PRD: Fruit yield = 3.042 (Leaf-N) + 33.478 (Leaf-K) – 0.162 (SΨs) - 0.089 (gs) + 13.409 (WBI) – 7.713 (P < 0.05; R 2 = 0.94; RMSE = 1.31%) (for 2010) Yield prediction under DI and PRD For DI (2011)

Conclusions PRD at 50% FI produced 9% less fruit yield, with marginally lower vegetative growth of the plants in comparison to that under FI. However, 50% water saving under PRD 50 boosted the irrigation water use efficiency up to 83% higher than that under FI. Yield prediction using PC-regression with leaf-N, leaf-K, stem water potential stress index, stomatal conductance and water band index gives satisfactory result. Therefore, this technique can be used for yield forecasting of citrus orchards under differential water stress condition and such methodology may be tried for other crops also.

THANK YOU