/
Print out page 3 only Print out page 3 only

Print out page 3 only - PowerPoint Presentation

alida-meadow
alida-meadow . @alida-meadow
Follow
384 views
Uploaded On 2016-07-06

Print out page 3 only - PPT Presentation

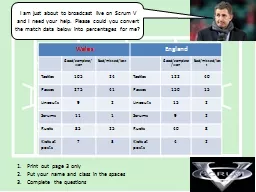
Put your name and class in the spaces Complete the questions Wales England Goodcompletewon Badmissedlost Goodcompletewon Badmissedlost Tackles 105 24 Tackles 122 40 Passes 275 ID: 393115

22m time page complete time 22m complete page wales convert data tackles spent good 100 task posts england zone

Share:

Link:

Embed:

Download Presentation from below link

Download Presentation The PPT/PDF document "Print out page 3 only" is the property of its rightful owner. Permission is granted to download and print the materials on this web site for personal, non-commercial use only, and to display it on your personal computer provided you do not modify the materials and that you retain all copyright notices contained in the materials. By downloading content from our website, you accept the terms of this agreement.


Presentation Transcript

Slide1

Print out page 3 only

Put your name and class in the spacesComplete the questions

WalesEnglandGood/complete/wonBad/missed/lostGood/complete/wonBad/missed/lostTackles10524Tackles12240Passes27541Passes15015Lineouts92Lineouts152Scrums111Scrums92Rucks8525Rucks408Kicks at posts73Kicks at posts42

I am just about to broadcast live on Scrum V and I need your help. Please could you convert the match data below into percentages for me?Slide2

Use the stats from above to complete the worksheet on page 3.

Time Statistics

Wales 15mins 20mins 32mins 13mins 5mins 17mins 42mins 16mins EnglandThe time spent in each section of the pitch is expressed in minutes. You must convert these figures into a percentage.Time in minutes ÷ length of match (80minutes) x 100 = ??%For example:Wales own 22m (15 ÷ 80) x 100 = 18.75%Complete the answers on the following sheetSlide3

Wales England

Good as a %

Bad as a %Tackles81%PassesLineoutsScrumsRucksKicks at postsTask 1 – Convert the data from page 1 into percentages (%). For example, Wales tackles can be converted by using the following formula: Good tackles ÷ Total number of tackles 105 ÷ 129 = 0.81 0.81 x 100 = 81% Task 2 – Time Statistics (Use data and example on page 2)Good as a %Bad as a %TacklesPassesLineoutsScrumsRucksKicks at posts

Zone

% of time spent in zone

Own 22m

18.75%

22m

– Half way

Half

way – opponents 22m

Opponents

22m

Zone

% of time spent in

zone

Own 22m

22m

– Half way

Half

way – opponents 22m

Opponents

22m

Name:____________________________________ Class:__________________