/
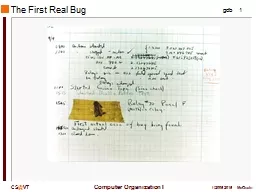
The First Real Bug Debugging The First Real Bug Debugging

The First Real Bug Debugging - PowerPoint Presentation

alida-meadow
alida-meadow . @alida-meadow
Follow
365 views
Uploaded On 2018-02-21

The First Real Bug Debugging - PPT Presentation

vs Testing Software testing is any activity aimed at evaluating an attribute or capability of a program and determining whether it meets its specified results Debugging is a methodical process of finding and reducing the number of ID: 633635

program prime code gdb prime program gdb code source true error int execution command line debugging upperbound user return

Share:

Link:

Embed:

Download Presentation from below link

Download Presentation The PPT/PDF document "The First Real Bug Debugging" is the property of its rightful owner. Permission is granted to download and print the materials on this web site for personal, non-commercial use only, and to display it on your personal computer provided you do not modify the materials and that you retain all copyright notices contained in the materials. By downloading content from our website, you accept the terms of this agreement.


Presentation Transcript

Slide1

The First Real BugSlide2

Debugging vs

Testing

Software testing

is any activity aimed at evaluating an attribute or capability of a program and determining whether it meets its specified results

Debugging is a methodical process of finding and reducing the number of bugs, or defects, in a computer program …, thus making it behave as expected

All about "does it work"?

All about "why does it not work" and "what can we do about that"?

They are fundamentally different activities.

Testing can indicate the

need

to debug, but often provides only superficial clues as to the

location

or

nature

of the error.Slide3

printf()

as an Aid

Perhaps the simplest approach to debugging is to add output code to the program in order to display the values of selected variables and indicate flow of control as the program executes.

This is often referred to as instrumenting the code.

- Easy to apply. - Use preprocessor directives to enable/disable diagnostic output. - Lets the code tell you what is actually happening, as opposed to what you believe is happening – psychological issues often hinder debugging.

- Can be cumbersome and difficult to "tune".

This technique is often undervalued and often overvalued.Slide4

gdb: the GNU Debugger

gdb

is a system tool that allows the user to:

- Step through the execution of a program, instruction by instruction.

- View and even modify the values of variables. - Set breakpoints that cause the execution of a program to be halted at specific places in the code. - Set

watchpoints that cause the execution of a program to be halted whenever the value of a user-defined expression changes. - Show a list of the active stack frames.

- Display a range of source code lines. - Disassemble the current machine code to assembly language.

… and more.Slide5

Some gdb

Resources

The Art of Debugging with GDB, DDD, and Eclipse,

N Matloff & P J Salzman,

No Starch Press (c)2008 ISBN 978-1-593-27174-9

Some reasonably good gdb cheatsheets:

http://darkdust.net/files/GDB%20Cheat%20Sheet.pdf

http://

www.yolinux.com/TUTORIALS/GDB-Commands.htmlSlide6

Example Program

The C source for our running example follows… it is adapted from an example by Norman

Matloff

(http://heather.cs.ucdavis.edu/~matloff/UnixAndC/CLanguage/Debug.html):

#include <stdio.h>#include <

stdbool.h>

/* prime-number finding program

Will (after bugs are fixed) report a list of all primes

which are less than or equal to the user-supplied upper

bound.

This code is riddled with errors! */

#define MAXPRIMES 100

void

CheckPrime

(

int

K,

bool

Prime[]);

. . .Slide7

Example Program

. . .

int

main() {

int N;

int

UpperBound; /*

we will check all numbers up

through this one for

primeness

*/

bool

Prime[MAXPRIMES

] = {0};

/*

Prime[I] will be true if I is

prime, false otherwise */

printf

("enter upper bound\n");

scanf

("%d",

UpperBound

);

Prime[2] = true;

for (N = 3; N <=

UpperBound

; N += 2)

CheckPrime

(N, Prime);

if ( Prime[N] )

printf

("%d is a prime\

n",N

);

return 0;

}Slide8

Example Program

. . .

void

CheckPrime

(int K, bool

Prime[]) {

int

J;

/* the plan: see if J divides K, for all values J which

are

(a) themselves prime (no need to try J if it is

nonprime), and

(b) less than or equal to

sqrt

(K) (if K has a divisor

larger than this square root, it must also have a

smaller one, so no need to check for larger ones)

*/Slide9

Example Program

. . .

J = 2;

while ( true ) { if ( Prime[J] ) if ( K % J == 0 ) { Prime[K] = false;

return; }

J++; }

/* if we get here, then there were no divisors of K, so

K must be prime */

Prime[K] = true;

}Slide10

Compiling for Debugging

In order to take full advantage of

gdb's

features, you should generally: - disable code optimizations by using –O0

. - enable the generation of extra debugging information by using –g, or better, by using –ggdb3

.So, in this case, I compiled the preceding source code using the command line:

gcc -o matloff1 -

std

=c99 -O0 -

ggdb3

matloff1.c

This results in

two compiler warnings,

which I unwisely ignore…Slide11

Running the Program

I executed the program by typing the command

matloff1

.

The program prompts the user for a bound on the number of values to be checked; I entered the value 20.The continuing execution of the program resulted in the following message:

Segmentation faultThis indicates a runtime error related to an impermissible access to memory… but why?Slide12

Starting

gdb

Start the debugger by typing the command

gdb matloff1.

gdb starts up with a copyright message and then displays a user prompt: Slide13

Runnning

the Program

Begin execution of the program by entering the

run command, then respond to the user prompt:

Now, this gives us some information, including the address of the (machine) instruction that caused the error, and the function in which the error occurred.

But

_

IO_vfscanf

()

is a system function, not user code…Slide14

Backtrace

We can get more information about how we arrived at the error by using

backtrace

:

This shows the stack contains three stack frames at the time the error occurs, and provides the crucial information that:

line 23 in

main() called

__isoc99_scanf()

,

which called

_

IO_vfscanf

()

It seems unlikely either of the latter functions is incorrect… what's line 23?Slide15

List

We can display the relevant source by using

list

:

In this case, the error should be obvious, we passed the value of

UpperBound

to scanf

()

instead of passing the address of

UpperBound

… and

scanf

()

then treated that value as an address… with unpleasant results.Slide16

Kill

Before modifying the source code and rebuilding, we need to stop the running process, by using the

kill

command:Slide17

Fix the First Bug

We fix the error by inserting the address-of operator:

. . .

int

main() {. . .

scanf("%d", &

UpperBound);. . .

Now, rebuild as before and try running the program again…

Segmentation fault

Note: I opened a second terminal window to perform the rebuild and test the program again… that saves the time to exit and restart

gdb

(of course, in this case I knew in advance there were more bugs). Slide18

Running the Program Again

Restart the program within

gdb

and see what happens:

This time we got better information because the source for

matloff1.c

is available.We know:

-

CheckPrime

()

was called with

K == 3

- The error occurred in evaluating

Prime[j]Slide19

List

As before, let's see what the surrounding code is:

Hm

… that's somewhat informative. Apparently

J

must be out of bounds.Slide20

Print

We can see the value of a variable by using the command

print

:

Well,

Prime[]

is of dimension 100, so that is certainly out of bounds… how did this happen?Better take a somewhat wider look at the source… certainly "

while (true)

" looks a bit odd.Slide21

The Source

In this case, I find it easier to just switch to my text editor and see what's going on:

. . .

/* the plan: see if J divides K, for all values J which

are (a) themselves prime (no need to try J if it is

nonprime), and (b) less than or equal to

sqrt(K) (if K has a divisor larger than this square root, it must also have a

smaller one, so no need to check for larger ones)

*/

J = 2;

while ( true ) {

if ( Prime[J] )

if ( K % J == 0 ) {

Prime[K] = false;

return;

}

J++;

}

. . .

The loop bears no resemblance to the stated plan… the code never tries to limit

J

to be less than or equal to

sqrt

(K)

.Slide22

The Problem

The loop never exits unless we have a value for

J

such that both: - Prime[J] == true

- J divides K

J = 2;

while ( true ) { if ( Prime[J] )

if ( K % J == 0 ) {

Prime[K] = false;

return;

}

J++;

}

. . .

But we know that

J

reached the value 4032.

Why didn't the loop exit when we reached

J == 3

?

It must have been that

Prime[3]

was not

true

.

Examining the earlier source code, we see that

Prime[3]

will not have been explicitly set at this point.

We could fix this by assuming each

K

is prime until shown otherwise, and so setting

Prime[K]

to

true

before entering the function…

But if

K == 3

then the first prime that divides

K

would be 3 itself.Slide23

Fixing the Second Bug

. . .

/* the plan: see if J divides K, for all values J which

are

(a) themselves prime (no need to try J if it is nonprime), and (b) less than or equal to

sqrt(K) (if K has a divisor

larger than this square root, it must also have a smaller one, so no need to check for larger ones) */

for ( J = 2; J * J <= K; J++ ) {

if ( Prime[J] )

if ( K % J == 0 ) {

Prime[K] = false;

return;

}

J++;

}

. . .

But it's more efficient to make the loop exit once we've examined all the necessary candidates for divisors of

K

:Slide24

Trying Again

Well, no segmentation fault… but this didn't report any primes up to 20…

What to do when we have no immediate indication of what's wrong?

It would seem useful to trace the execution of the program.Slide25

Breakpoints

gdb

allows us to set

breakpoints, that is positions at which execution will automatically halt:

Important:

the displayed line of code has NOT been executed yet!Slide26

Stepping Through

gdb

also allows us to step through the program one instruction at a time:

Since line 23 is a

scanf

()

call, we must enter the input value and hit return before gdb resumes by displaying the next instruction.Slide27

Display and More Stepping

The

gdb

command display is like print except that the value of the specified variable is shown after each step is taken:

The initial display of

N

makes sense (why?), as does the next.

But execution goes from line 27 to line 28 and back to line 27… that's not what we expected… (see the source for

main()

).Slide28

. . .

int

main() {

. . . for (N = 3; N <=

UpperBound; N += 2) { CheckPrime

(N); if ( Prime[N] )

printf("%d is a prime\n",N

);

}

. . .

Fixing the Third Bug

Ah… missing braces around the intended body of the

for

loop:

BTW, this is why I suggest you ALWAYS put braces around the body of a selection or loop structure.Slide29

Trying Again

You might want to use the

clear

command to reset the breakpoint.

OK, this looks better, but we missed the prime 2 and reported that 9 and 15 are prime.

See the source code for the reason for these final bugs…