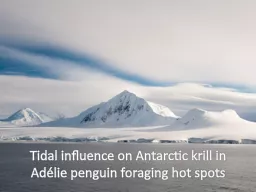
Penguin Foraging Patterns Figures courtesy of Matt Oliver 10 years of data Sampling Tidal Phase Variability What we can see with acoustics Sea floor httpdetlaphiltdicblogspotcom Krill Biomass ID: 327327
Download Presentation The PPT/PDF document "Tidal influence on Antarctic krill in Ad..." is the property of its rightful owner. Permission is granted to download and print the materials on this web site for personal, non-commercial use only, and to display it on your personal computer provided you do not modify the materials and that you retain all copyright notices contained in the materials. By downloading content from our website, you accept the terms of this agreement.
Slide1
Tidal influence on Antarctic krill in Adélie penguin foraging hot spotsSlide2
Penguin Foraging Patterns
Figures courtesy of Matt Oliver
10 years of dataSlide3
SamplingSlide4
Tidal Phase VariabilitySlide5
What we can see with acoustics
Sea floor
http://detlaphiltdic.blogspot.comSlide6
Krill Biomass
Krill Biomass
Estimate of weight (grams) of krill through water column at a single point
Averaged over survey grid for each day = mean daily krill biomassSlide7
Krill Aggregations
Krill Aggregations
For each aggregation we calculate:
Mean depth, dimensions (L, H), nearest neighbor distance
Volumetric abundance and biomass (ind. m-3 and g m-3)Aggregation-specific integrated biomass (g m-2)Biomass encounter rate (kg m-1)Slide8
Mean Daily Krill Biomass
Error bars are 2 standard errorsSlide9
Nearshore Tidal and Offshore ComparisonsSlide10
Spatial Krill Distribution Patterns
Semi
-Diurnal
TideSlide11
Spatial Krill Distribution
Patterns
Diurnal
TideSlide12
Optimal Foraging and
Krill Aggregation Structure
Central place foraging
Minimize foraging time
Maximize energy intakeKrill aggregation structure impacts foraging efficiencyDepth, size, densities and distance to next aggregation are importantSlide13
Variability in Aggregation Structure
Diurnal Tide
Shallow
LargeCloser
togetherMore denseHighest biomass encounter rateSemi-Diurnal TideDeepSmallFurther apartMore denseLow biomass encounter rate
Shallow
Large
Further apart
Less dense
Low biomass encounter rate
Palmer DeepSlide14
Summary…and more questions
Nearshore Antarctic krill distribution patterns are highly variable
Tide plays a role - but how?
Aggregation structure seems to be affected by tide and has an impact on penguin foraging, but to what degree?What types of aggregations are penguins going after?Slide15
Pilot Field Season
Palmer 2013-2014Two acoustic grids within the Palmer Station boating limits:
East Grid (~13 nm, 23 km)West Grid (~12 nm, 22 km)Traveling at ~3-4 knots = 6-8 hoursSampling as frequently as possible
Predator observations from the water – species identification, behaviorSlide16
Acoustic Grids