PDF-Under the Patronage of His Majesty the King
Author : alida-meadow | Published Date : 2016-04-21
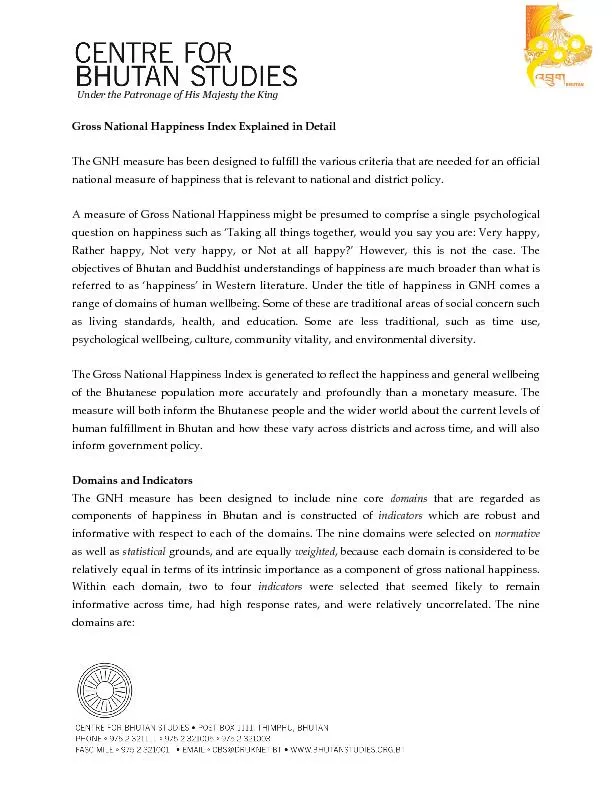
Gross National Happiness Index Explained in Detail The GNH measure has been designed to fulfill the various criteria that are needed for an official national measure
Presentation Embed Code
Download Presentation
Download Presentation The PPT/PDF document "Under the Patronage of His Majesty the K..." is the property of its rightful owner. Permission is granted to download and print the materials on this website for personal, non-commercial use only, and to display it on your personal computer provided you do not modify the materials and that you retain all copyright notices contained in the materials. By downloading content from our website, you accept the terms of this agreement.
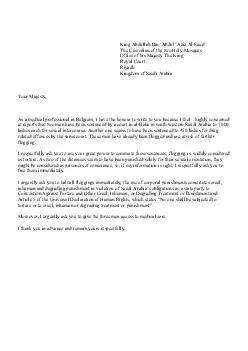
Under the Patronage of His Majesty the King: Transcript
Download Rules Of Document
"Under the Patronage of His Majesty the King"The content belongs to its owner. You may download and print it for personal use, without modification, and keep all copyright notices. By downloading, you agree to these terms.
Related Documents