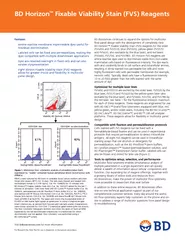
/
Figure S1 . Effect of avutometinib on cell viability of NCI-H358 cells. Figure S1 . Effect of avutometinib on cell viability of NCI-H358 cells.

Figure S1 . Effect of avutometinib on cell viability of NCI-H358 cells. - PowerPoint Presentation

amelia
amelia . @amelia
Follow
64 views
Uploaded On 2024-01-29

Figure S1 . Effect of avutometinib on cell viability of NCI-H358 cells. - PPT Presentation

The NCIH358 cells were treated with avutometinib for 72 h Cell viability was determined using the CCK8 assay Data are representative of three independent experiments Figure S2 Knockdown effect of ID: 1042181

cells avutometinib nci cell avutometinib cells cell nci defactinib kras h358 figure effect combination mutated nmol data treated small

Share:

Link:

Embed:

Download Presentation from below link

Download Presentation The PPT/PDF document "Figure S1 . Effect of avutometinib on ce..." is the property of its rightful owner. Permission is granted to download and print the materials on this web site for personal, non-commercial use only, and to display it on your personal computer provided you do not modify the materials and that you retain all copyright notices contained in the materials. By downloading content from our website, you accept the terms of this agreement.


Presentation Transcript

1. Figure S1. Effect of avutometinib on cell viability of NCI-H358 cells.The NCI-H358 cells were treated with avutometinib for 72 h. Cell viability was determined using the CCK-8 assay. Data are representative of three independent experiments.

2. Figure S2. Knockdown effect of Myc expression on each signal in KRAS-mutated non-small cell lung cancer cells.ABA nonspecific control (siSCR) or siRNA specific to Myc (siMyc) was introduced into the indicated cells. A. After incubation for 24 h, qRT-PCR was used to assess IGF-1 mRNA expression. p-values were calculated using Student's t-tests. B. After incubation for 72 h, the cells were lysed, and the indicated proteins were detected via western blotting.

3. Figure S3. Effect of avutometinib on cell viability in KRAS-mutated NSCLC cells.ABCDA. KRAS-mutated NSCLC cells were treated with avutometinib (200 nmol/L) for 72 h. Cell viability was determined using CCK-8 assay. B. Based on the result of A, cells were further divided into groups of epithelial and mesenchymal phenotypes, and comparative data are shown (p = 0.456). C. Based on the result of A, cells were further divided into groups of KRAS G12C and non-G12C point mutation, and comparative data are shown (p = 0.926). D. Based on the result of A, cells were further divided into groups with or without LKB1 mutation, and comparative data are shown (p = 0.005). B, C, and D. p values were calculated using student's t-tests.NSCLC, non-small cell lung cancer.

4. EpithelialMesenchymalFigure S4. Effect of treatment with avutometinib plus defactinib on the cell viability of KRAS-mutated non-small cell lung cancer cells.ABA. NCI-H358, NCI-H2122 and NCI-H441 (epithelial phenotype), and Calu-1 (mesenchymal phenotype) cells were treated with avutometinib in the presence or absence of defactinib (1 μmol/L) for 72 h, and cell viability was assessed using CCK-8 assay. The data shown is representative of three independent experiments. B. Cells were treated with DMSO, avutometinib (150 nmol/L), defactinib (1 μmol/L), or a combination with avutometinib (150 nmol/L) and defactinib (1 μmol/L) for 15 days with the drugs replenished every 72 h. The plates were stained with crystal violet. Each plate is representative of three independent experiments.

5. Figure S5. Effect of treatment with avutometinib plus defactinib on the cell cycle of KRAS-mutated non-small cell cancer cells.NCI-H358, NCI-H2122 and NCI-H441 (epithelial phenotype), and Calu-1 (mesenchymal phenotype) cells were treated with DMSO, avutometinib (150 nmol/L), defactinib (1 μmol/L) or a combination with avutometinib (150 nmol/L) and defactinib (1 μmol/L) for 48 h (NCI-H2122 and Calu-1) or 72 h (NCI-H358 and NCI-H441), and the cell cycle was analyzed via flow cytometry using FACS Accuri. The data are representative of three independent experiments.

6. Figure S6. Effect of treatment with avutometinib plus defactinib on cell migration of KRAS-mutated non-small cell lung cancer cells. NCI-H358 and NCI-H2122 cells were treated with DMSO, avutometinib (150 nmol/L), defactinib (1 µmol/L) or a combination with avutometinib (150 nmol/L) and defactinib (1 μmol/L) for 24 h. Cell migration was assessed using the scratch assay. Data are representative of three independent experiments.

7. Figure S7. Effect of combination with avutometinib and defactinib in NCI-H358 cells in vivo.ABNCI-H358 CDX model avutometinib (28 days by oral administration with vehicle, defactinib (3.0 mg/kg) and avutometinib (0.1 mg/kg), or a combination of defactinib (3.0 mg/kg) and avutometinib (0.1 mg/kg) (n = 6 per group). A. Tumor volumes of each mouse treated with the combination treatment were measured over time from the start of treatment, and the results are shown (mean ± SEM). B. Mice were weighed twice weekly, and the results are shown (mean ± SEM).

8. Figure S8. Schematic presentation of how combination treatment with FAK inhibitor and avutometinib induce cell apoptosis in KRAS-mutated non-small cell lung cancer cells.Avutometinib monotherapyAvutometinib + Defactinib