PPT-Midterm II Distribution Average = 75.3
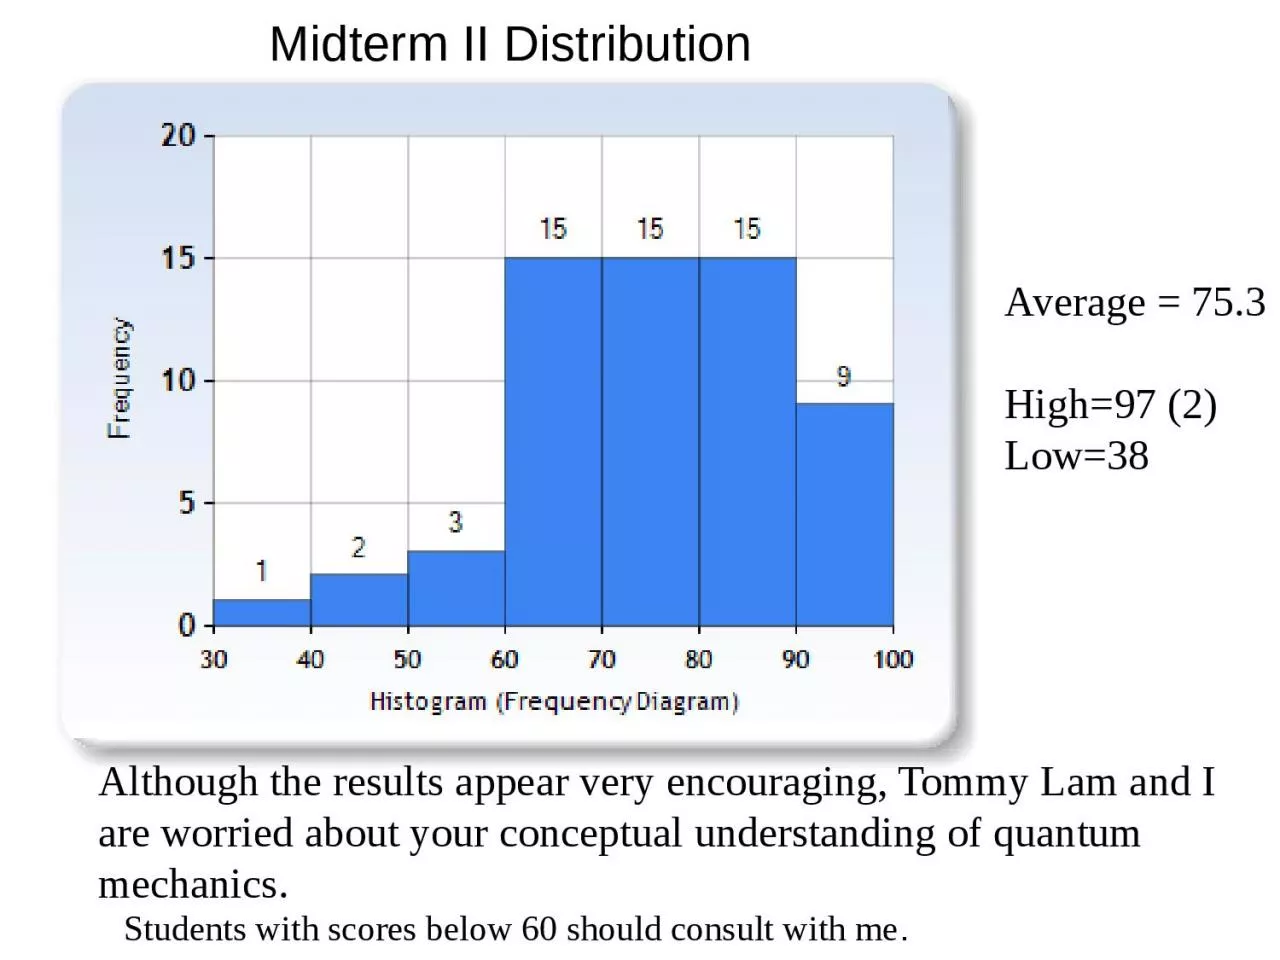
High97 2 Low38 Although the results appear very encouraging Tommy Lam and I are worried about your conceptual understanding of quantum mechanics Students with scores
Download Presentation
"Midterm II Distribution Average = 75.3" is the property of its rightful owner. Permission is granted to download and print materials on this website for personal, non-commercial use only, provided you retain all copyright notices. By downloading content from our website, you accept the terms of this agreement.
Presentation Transcript
Transcript not available.