/
Characterization of the Characterization of the

Characterization of the - PowerPoint Presentation

askindma
askindma . @askindma
Follow
343 views
Uploaded On 2020-06-17

Characterization of the - PPT Presentation

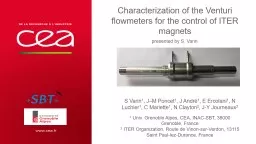
Venturi flowmeters for the control of ITER magnets S Varin 1 JM Poncet 1 J André 1 E Ercolani 1 N Luchier 1 C Mariette 1 N Clayton 2 JY Journeaux 2 1 Univ Grenoble Alpes CEA INACSBT 38000 Grenoble France ID: 779774

flowmeters flow pressure manufacturing flow flowmeters manufacturing pressure coefficient strategy upstream mass sizing warm measurement cold flowrate full characterization

Share:

Link:

Embed:

Download Presentation from below link

Download The PPT/PDF document "Characterization of the" is the property of its rightful owner. Permission is granted to download and print the materials on this web site for personal, non-commercial use only, and to display it on your personal computer provided you do not modify the materials and that you retain all copyright notices contained in the materials. By downloading content from our website, you accept the terms of this agreement.


Presentation Transcript

Slide1

Characterization of the Venturi flowmeters for the control of ITER magnets

S Varin1, J–M Poncet1, J André1, E Ercolani1, N Luchier1, C Mariette1, N Clayton2, J-Y Journeaux21 Univ. Grenoble Alpes, CEA, INAC-SBT, 38000 Grenoble, France2 ITER Organization, Route de Vinon-sur-Verdon, 13115 Saint Paul-lez-Durance, France

presented

by S. Varin

Slide2

Context

IntroductionJune 2014: Supply contract between CEA-SBT and the Magnet Division of the ITER OrganizationCEA/SBT was in charge of the design, manufacturing & delivery of 277 flowmeters

June 2018: Final delivery

Flowmeters will be used to operate

the superconducting magnet system of the ITER tokamak

Slide3

Design, manufacturing & delivery of 277 flowmeters

Reynolds number not included in the standard NF EN ISO 5167-4

(2×10⁵

< Re < 1×10

6

)

Experimental characterisation

M

anufacturing strategy

Introduction

SizeMass flowrateTemperaturePressureReynolds numberNumberDN80.1 to 1 g/sNear 300 K3.8 to 4 bar6×102 to 6×10318DN101 to 7 g/sNear 300 K3 to 4 bar3×103 to 3×10442DN15.202 to 20 g/s4.2 to 6 K4 to 10 bar4×104 to 5×10589DN15.303 to 30 g/s4.2 to 6 K4 to 10 bar6×104 to 8×10528DN2013 to 130 g/s4.2 to 6 K4 to 10 bar2×105 to 3×10640DN2540 to 400 g/s4.2 to 6 K4 to 10 bar4×105 to 6×10660

Operation of the current

leads

at room temperature

Control of the supercritical helium flow in the

magnets

Slide4

Sizing

Sizing and manufacturing strategy21°

D

d

d

Flow


Where:

: mass

flowrate, density of the fluid, pressure at the neck diameter upstream and neck diameters: pressure and temperature in the upstream pipe: flow coefficient, with the expansion factor and the discharge coefficient  Designed following the standard NF EN ISO 5167-4

Slide5

Measurement accuracy

Sizing and manufacturing strategy


Where:

The subscript m refers to the uncertainties resulting from the measurement at CEA/SBT

: mass

flowrate

upstream density

upstream and neck diameters

: upstream pressure and temperature: differential pressure between the upstream section of the Venturi tube and its restriction 

Slide6

Manufacturing strategy

Sizing and manufacturing strategy277 flowmeters  avoid an individual characterization Tight dimensional tolerancesReproducible behaviourSampling measurement

Slide7

Sizing and manufacturing strategy

Slide8

Warm bench

Method for the characterization of flowmetersDetermination of the flow coefficient by comparison with a Coriolis flowmeter

Slide9

Method for the characterization of flowmeters

Cold benchLoop cooled by a helium refrigerator producing 800 W @4.5 KTest of 9 Venturi tubesDetermination of the flow coefficient by comparison with a Coriolis flowmeter

Slide10

Warm flow test

ResultsTest of 7 DN8 and 10 DN10 flowmetersInfluence of the pressure and differential pressure (mass flowrate) on the flow coefficientDifference between flow coefficients of a given type of flowmeters < 2% at full-range

Slide11

Cold flow test

ResultsTest of 9 flowmetersNo influence of the pressure, temperature and mass flowrateDifference between flow coefficients of a given type of flowmeters < 3% at full-range

Slide12

Achievement of the objectives

Validation of the manufacturing strategyDetermine the flow coefficient Constant values for cold flowmeters Flow coefficient fits as a function of the differential pressure for warm flowmetersValidate the manufacturing strategy

Reproducible behaviour (difference between flowmeters of a given type <3% at full-range)

Slide13

Probable

error on the measurement of the mass flowrateValidation of the manufacturing strategyInfluence of the mass flowrate on the measurement accuracy5.22


Slide14

Conclusion

ConclusionTest of 17 warm flowmeters & 9 cold flowmetersDetermination of the flow coefficientConstant for cold flowmetersFlow coefficient fits as a function of the differential pressure for warm flowmetersReproducible behaviour  Validation of the manufacturing strategy

Good accuracy 2

% at full-range

(

except in the neighbourhood of the critical point)

The technical specifications were met for all flowmeters