/
Key Operating Metrics of Tape AB US Equities Securities Information Pr Key Operating Metrics of Tape AB US Equities Securities Information Pr

Key Operating Metrics of Tape AB US Equities Securities Information Pr - PDF document

audrey
audrey . @audrey
Follow
342 views
Uploaded On 2021-10-04

Key Operating Metrics of Tape AB US Equities Securities Information Pr - PPT Presentation

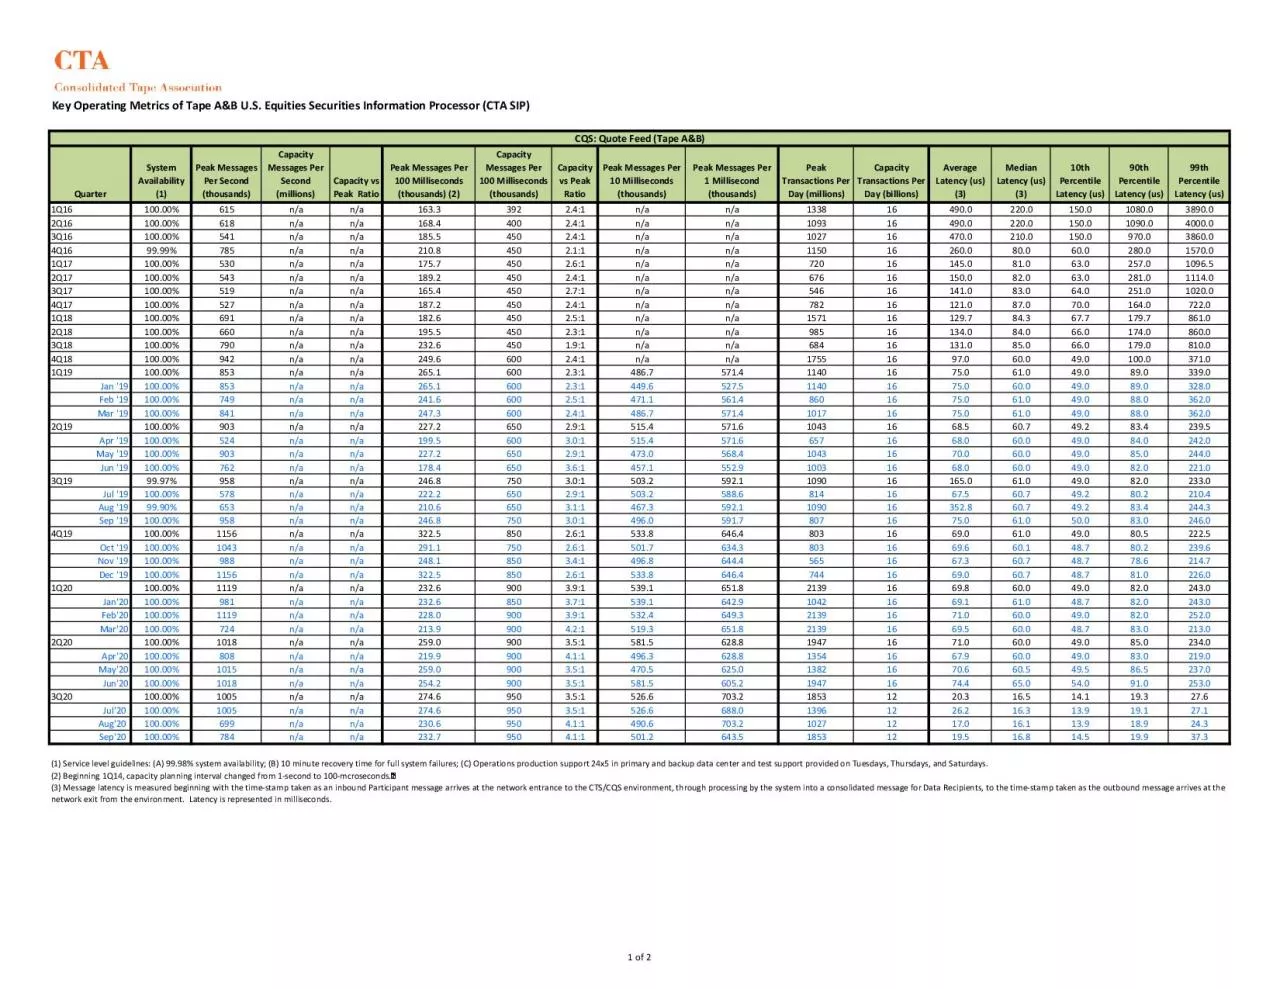
QuarterSystem Availability 1Peak Messages Per Second thousandsCapacity Messages Per Second millionsCapacity vs Peak Ratio Peak Messages Per 100 Milliseconds thousands 2Capacity Messages Per 100 Milli ID: 895080

1000 100 peak 105 100 1000 105 peak latency 300 capacity messages thousands 450 message milliseconds system 250 150

Share:

Link:

Embed:

Download Presentation from below link

Download Pdf The PPT/PDF document "Key Operating Metrics of Tape AB US Equi..." is the property of its rightful owner. Permission is granted to download and print the materials on this web site for personal, non-commercial use only, and to display it on your personal computer provided you do not modify the materials and that you retain all copyright notices contained in the materials. By downloading content from our website, you accept the terms of this agreement.


Presentation Transcript

1 Key Operating Metrics of Tape A&B U.S. E
Key Operating Metrics of Tape A&B U.S. Equities Securities Information Processor (CTA SIP) Quarter System Availability (1) Peak Messages Per Second (thousands) Capacity Messages Per Second (millions) Capacity vs Peak Ratio Peak Messages Per 100 Milliseconds (thousands) (2) Capacity Messages Per 100 Milliseconds (thousands) Capacity vs Peak Ratio Peak Messages Per 10 Milliseconds (thousands) Peak Messages Per 1 Millisecond (thousands) Peak Transactions Per Day (millions) Capacity Transactions Per Day (billions) Average Latency (us) (3) Median Latency (us) (3) 10th Percentile Latency (us) 90th Percentile Latency (us) 99th Percentile Latency (us) 1Q16 100.00% 615 n/a n/a 163.3 392 2.4:1 n/a n/a 1338 16 490.0 220.0 150.0 1080.0 3890.0 2Q16 100.00% 618 n/a n/a 168.4 400 2.4:1 n/a n/a 1093 16 490.0 220.0 150.0 1090.0 4000.0 3Q16 100.00% 541 n/a n/a 185.5 450 2.4:1 n/a n/a 1027 16 470.0 210.0 150.0 970.0 3860.0 4Q16 99.99% 785 n/a n/a 210.8 450 2.1:1 n/a n/a 1150 16 260.0 80.0 60.0 280.0 1570.0 1Q17 100.00% 530 n/a n/a 175.7 450 2.6:1 n/a n/a 720 16 145.0 81.0 63.0 257.0 1096.5 2Q17 100.00% 543 n/a n/a 189.2 450 2.4:1 n/a n/a 676 16 150.0 82.0 63.0 281.0 1114.0 3Q17 100.00% 519 n/a n/a 165.4 450 2.7:1 n/a n/a 546 16 141.0 83.0 64.0 251.0 1020.0 4Q17 100.00% 527 n/a n/a 187.2 450 2.4:1 n/a n/a 782 16 121.0 87.0 70.0 164.0 722.0 1Q18 100.00% 691 n/a n/a 182.6 450 2.5:1 n/a n/a 1571 16 129.7 84.3 67.7 179.7 861.0 2Q18 100.00% 660 n/a n/a 195.5 450 2.3:1 n/a n/a 985 16 134.0 84.0 66.0 174.0 860.0 3Q18 100.00% 790 n/a n/a 232.6 450 1.9:1 n/a n/a 684 16 131.0 85.0 66.0 179.0 810.0 4Q18 100.00% 942 n/a n/a 249.6 600 2.4:1 n/a n/a 1755 16 97.0 60.0 49.0 100.0 371.0 1Q19 100.00% 853 n/a n/a 265.1 600 2.3:1 486.7 571.4 1140 16 75.0 61.0 49.0 89.0 339.0 Jan '19 100.00% 853 n/a n/a 265.1 600 2.3:1 449.6 527.5 1140 16 75.0 60.0 49.0 89.0 328.0 Feb '19 100.00% 749 n/a n/a 241.6 600 2.5:1 471.1 561.4 860 16 75.0 61.0 49.0 88.0 362.0 Mar '19 100.00% 841 n/a n/a 247.3 600 2.4:1 486.7 571.4 1017 16 75.0 61.0 49.0 88.0 362.0 2Q19 100.00% 903 n/a n/a 227.2 650 2.9:1 515.4 571.6 1043 16 68.5 60.7 49.2 83.4 239.5 Apr '19 100.00% 524 n/a n/a 199.5 600 3.0:1 515.4 571.6 657 16 68.0 60.0 49.0 84.0 242.0 May '19 100.00% 903 n/a n/a 227.2 650 2.9:1 473.0 568.4 1043 16 70.0 60.0 49.0 85.0 244.0 Jun '19 100.00% 762 n/a n/a 178.4 650 3.6:1 457.1 552.9 1003 16 68.0 60.0 49.0 82.0 221.0 3Q19 99.97% 958 n/a n/a 246.8 750 3.0:1 503.2 592.1 1090 16 165.0 61.0 49.0 82.0 233.0 Jul '19 100.00% 578 n/a n/a 222.2 650 2.9:1 503.2 588.6 814 16 67.5 60.7 49.2 80.2 210.4 Aug '19 99.90% 653 n/a n/a 210.6 650 3.1:1 467.3 592.1 1090 16 352.8 60.7 49.2 83.4 244.3 Sep '19 100.00% 958 n/a n/a 246.8 750 3.0:1 496.0 591.7 807 16 75.0 61.0 50.0 83.0 246.0 4Q19 100.00% 1156 n/a n/a 322.5 850 2.6:1 533.8 646.4 803 16 69.0 61.0 49.0 80.5 222.5 Oct '19 100.00% 1043 n/a n/a 291.1 750 2.6:1 501.7 634.3 803 16 69.6 60.1 48.7 80.2 239.6 Nov '19 100.00% 988 n/a n/a 248.1 850 3.4:1 496.8 644.4 565 16 67.3 60.7 48.7 78.6 214.7 Dec '19 100.00% 1156 n/a n/a 322.5 850 2.6:1 533.8 646.4 744 16 69.0 60.7 48.7 81.0 226.0 1Q20 100.00% 1119 n/a n/a 232.6 900 3.9:1 539.1 651.8 2139 16 69.8 60.0 49.0 82.0 243.0 Jan'20 100.00% 981 n/a n/a 232.6 850 3.7:1 539.1 642.9 1042 16 69.1 61.0 48.7 82.0 243.0 Feb'20 100.00% 1119 n/a n/a 228.0 900 3.9:1 532.4 649.3 2139 16 71.0 60.0 49.0 82.0 252.0 Mar'20 100.00% 724 n/a n/a 213.9 900 4.2:1 519.3 651.8 2139 16 69.5 60.0 48.7 83.0 213.0 2Q20 100.00% 1018 n/a n/a 259.0 900 3.5:1 581.5 628.8 1947 16 71.0 60.0 49.0 85.0 234.0 Apr'20 100.00% 808 n/a n/a 219.9 900 4.1:1 496.3 628.8 1354 16 67.9 60.0 49.0 83.0 219.0 May'20 100.00% 1015 n/a n/a 259.0 900 3.5:1 470.5 625.0 1382 16 70.6 60.5 49.5 86.5 237.0 Jun'20 100.00% 1018 n/a n/a 254.2 900 3.5:1 581.5 605.2 1947 16 74.4 65.0 54.0 91.0 253.0 3Q20 100.00% 1005 n/a n/a 274.6 950 3.5:1 526.6 703.2 1853 12 20.3 16.5 14.1 19.3 27.6 Jul'20 100.00% 1005 n/a n/a 274.6 950 3.5:1 526.6 688.0 1396 12 26.2 16.3 13.9 19.1 27.1 Aug'20 100.00% 699 n/a n/a 230.6 950 4.1:1 490.6 703.2 1027 12 17.0 16.1 13.9 18.9 24.3 Sep'20 100.00% 784 n/a n/a 232.7 950 4.1:1 501.2 643.5 1853 12 19.5 16.8 14.5 19.9 37.3 (1) Service level guidelines: (A) 99.98% system availability; (B) 10 minute recovery time for full system failures; (C) Operations production support 24x5 in primary and backup data center and test support provided on Tuesdays, Thursdays, and Saturdays. (2) Beginning 1Q14, capacity planning interval changed from 1-second to 100-mcroseconds. (3) Message latency is measured beginning with the time-stamp taken as an inbound Participant message arrives at the network entrance to the CTS/CQS environment, through processing by the system into a consolidated message for Data Recipients, to the time-stamp taken as the outbound message arrives at the network exit from the environment. Latency is represented in milliseconds. CQS: Quote Feed (Tape A&B) 1 of 2 Quarter Syst

2 em Availability (1) Peak Messages Per
em Availability (1) Peak Messages Per Second (thousands) Capacity Messages Per Second (thousands) Capacity vs Peak Ratio Peak Messages Per 100 Milliseconds (thousands) (2) Capacity Messages Per 100 Milliseconds (thousands) Capacity vs Peak Ratio Peak Messages Per 10 Milliseconds (thousands) Peak Messages Per 1 Millisecond (thousands) Peak Transactions Per Day (millions) Capacity Transactions Per Day (millions) Average Latency (3) Median Latency (3) 10th Percentile Latency 90th Percentile Latency 99th Percentile Latency 1Q16 100.00% 123.0 n/a n/a 42.4 86 2.0:1 n/a n/a 49.8 1000 330.0 250.0 160.0 430.0 1730.0 2Q16 100.00% 91.9 n/a n/a 37.4 96 2.6:1 n/a n/a 45.6 1000 340.0 240.0 190.0 450.0 1730.0 3Q16 100.00% 98.2 n/a n/a 41.5 105 2.5:1 n/a n/a 33.8 1000 320.0 240.0 200.0 440.0 1650.0 4Q16 100.00% 94.3 n/a n/a 38.7 105 2.7:1 n/a n/a 49.3 1000 250.0 160.0 130.0 310.0 1410.0 1Q17 100.00% 121.8 n/a n/a 45.4 105 2.3:1 n/a n/a 32.9 1000 167.0 115.0 83.0 218.0 1023.0 2Q17 100.00% 98.2 n/a n/a 51.0 105 2.1:1 n/a n/a 32.4 1000 154.0 113.0 83.0 210.0 848.0 3Q17 100.00% 88.3 n/a n/a 46.9 105 2.2:1 n/a n/a 29.2 1000 144.0 113.0 83.0 199.0 708.0 4Q17 100.00% 67.6 n/a n/a 39.6 105 2.7:1 n/a n/a 38.5 1000 151.2 120.0 87.0 205.0 708.0 1Q18 100.00% 68.0 n/a n/a 35.8 105 2.9:1 n/a n/a 57.3 1000 146.7 119.0 87.3 198.3 661.7 2Q18 100.00% 77.3 n/a n/a 35.8 105 2.9:1 n/a n/a 40.2 1000 150.0 121.0 87.0 202.0 716.0 3Q18 100.00% 77.4 n/a n/a 31.0 105 3.4:1 n/a n/a 40.1 1000 150.0 122.0 85.0 206.0 648.0 4Q18 100.00% 91.9 n/a n/a 39.8 105 2.6:1 n/a n/a 55.3 1000 164.0 112.0 85.0 193.0 783.0 1Q19 100.00% 77.2 n/a n/a 38.3 105 2.7:1 84.1 117.6 41.7 1000 147.0 102.0 77.0 198.0 823.0 Jan '19 100.00% 76.5 n/a n/a 38.3 105 2.7:1 80.1 115.1 41.7 1000 147.0 103.0 80.0 194.0 882.0 Feb '19 100.00% 76.5 n/a n/a 37.0 105 2.8:1 81.0 117.6 39.2 1000 144.0 102.0 78.0 198.0 823.0 Mar '19 100.00% 77.2 n/a n/a 36.8 105 2.9:1 84.1 113.4 41.5 1000 149.0 100.0 72.0 199.0 810.0 2Q19 100.00% 98.4 n/a n/a 43.8 250 5.7:1 144.9 230.7 49.8 1000 138.9 94.0 69.7 179.5 647.8 Apr '19 100.00% 76.3 n/a n/a 37.2 105 2.8:1 81.9 113.5 41.7 1000 142.0 100.0 77.0 196.0 709.0 May '19 100.00% 98.3 n/a n/a 43.8 105 2.4:1 117.3 168.7 49.6 1000 156.4 94.9 76.3 190.5 708.5 Jun '19 100.00% 98.4 n/a n/a 40.1 250 6.2:1 144.9 230.7 49.8 1000 110.4 70.0 54.9 129.9 391.9 3Q19 99.82% 134.3 n/a n/a 54.1 250 4.6:1 174.8 245.2 55.6 1000 115.0 64.0 50.0 117.0 377.0 Jul '19 100.00% 59.2 n/a n/a 32.8 250 7.6:1 162.5 245.2 50.2 1000 83.8 64.1 50.1 117.6 369.2 Aug '19 99.46% 75.8 n/a n/a 39.8 250 6.3:1 162.5 240.2 55.6 1000 174.1 64.4 50.8 114.7 374.8 Sep '19 100.00% 134.3 n/a n/a 54.1 250 4.6:1 174.8 232.0 50.7 1000 86.0 65.0 49.0 118.0 388.0 4Q19 100.00% 207.4 n/a n/a 80.9 300 3.7:1 174.7 233.1 48.0 1000 87.0 66.0 50.0 119.0 435.0 Oct '19 100.00% 207.4 n/a n/a 80.9 300 3.7:1 169.7 233.1 48.0 1000 88.3 66.4 50.1 121.7 437.3 Nov '19 100.00% 128.9 n/a n/a 51.6 300 5.8:1 156.1 224.2 47.1 1000 87.0 65.4 49.2 118.2 437.3 Dec '19 100.00% 170.2 n/a n/a 77.8 300 3.9:1 174.7 228.7 47.2 1000 87.0 66.0 50.0 119.0 427.0 1Q20 100.00% 130.2 n/a n/a 67.5 300 4.4:1 165.5 261.2 89.2 1000 88.1 65.0 43.5 116.0 440.5 Jan '20 100.00% 125.9 n/a n/a 50.9 300 5.9:1 153.8 240.7 50.5 1000 87.1 65.0 43.0 118.0 430.0 Feb '20 100.00% 130.2 n/a n/a 47.1 300 6.4:1 165.5 261.2 89.2 1000 88.3 65.0 43.0 117.0 440.0 Mar '20 100.00% 123.6 n/a n/a 67.5 300 4.4:1 156.0 229.1 87.4 1000 89.0 64.5 45.0 107.0 454.0 2Q20 100.00% 150.5 n/a n/a 85.4 300 3.5:1 192.0 248.3 76.9 1000 94.5 66.0 47.0 115.0 482.0 Apr '20 100.00% 150.5 n/a n/a 85.4 300 3.5:1 184.7 232.5 76.9 1000 91.2 65.0 44.0 112.0 484.0 May '20 100.00% 143.8 n/a n/a 66.4 300 4.5:1 161.9 226.3 63.9 1000 92.4 65.5 45.5 114.5 464.5 Jun '20 100.00% 124.7 n/a n/a 54.4 300 5.5:1 192.0 248.3 73.6 1000 99.1 71.0 50.0 122.0 484.0 3Q20 100.00% 125.6 n/a n/a 84.4 350 4.1:1 200.3 326.3 60.4 500 19.2 17.8 15.1 21.3 29.0 Jul'20 100.00% 125.6 n/a n/a 60.2 350 5.8:1 198.0 305.7 56.4 500 19.2 17.7 15.1 21.1 29.1 Aug'20 100.00% 69.6 n/a n/a 39.4 350 8.9:1 185.2 326.3 57.3 500 18.4 17.7 14.9 20.9 27.9 Sep'20 100.00% 86.7 n/a n/a 84.4 350 4.1:1 200.3 299.9 60.4 500 20.0 18.2 15.5 21.8 31.1 (1) Service level guidelines: (A) 99.98% system availability; (B) 10 minute recovery time for full system failures; (C) Operations production support 24x5 in primary and backup data center and test support provided on Tuesdays, Thursdays, and Saturdays. (2) Beginning 1Q14, capacity planning interval changed from 1-second to 100-milliseconds. (3) Message latency is measured beginning with the time-stamp taken as an inbound Participant message arrives at the network entrance to the CTS/CQS environment, through processing by the system into a consolidated message for Data Recipients, to the time-stamp taken as the outbound message arrives at the network exit from the environment. Latency is represented in microseconds. CTS: Trade Feed (Tape A&B) 2 of