/
You don’t have to fret about FRET You don’t have to fret about FRET

You don’t have to fret about FRET - PowerPoint Presentation

bella
bella . @bella
Follow
27 views
Uploaded On 2024-02-09

You don’t have to fret about FRET - PPT Presentation

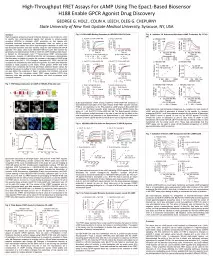
a guide to designing and analysing FRET experiments Joe Jan 2018 Fluorescence resonance energy transfer FRET Conceptually FRET is a very simple method to understand D A Donor and Acceptor ID: 1045812

donor acceptor emission fret acceptor donor fret emission distance energy wavelength fluorescence efficiency transfer spectrum measured distances state excitation

Share:

Link:

Embed:

Download Presentation from below link

Download Presentation The PPT/PDF document "You don’t have to fret about FRET" is the property of its rightful owner. Permission is granted to download and print the materials on this web site for personal, non-commercial use only, and to display it on your personal computer provided you do not modify the materials and that you retain all copyright notices contained in the materials. By downloading content from our website, you accept the terms of this agreement.


Presentation Transcript

1. You don’t have to fret about FRET(a guide to designing and analysing FRET experiments)JoeJan 2018

2. Fluorescence resonance energy transfer (FRET) Conceptually FRET is a very simple method to understandDADonor and AcceptorClose in space

3. FRET is a spectroscopic process by which a donor fluorophore transfers energy non-radiatively over long distances (10-90 Å) to an acceptor fluorophore. The relationship between fluorophore distance and energy transfer was first described by Förster in the 1940’s.

4. A number of advantages are inherent to this technique: 1) Sensitivity of fluorescence-based detection.2) Relatively short timescale of energy transfer.3) Appreciable range of distances over which it can be applied.4) Radiation-less transmission of energy from a donor molecule to an acceptor molecule. 5) This resonance interaction occurs over greater than inter-atomic distances, without conversion to thermal energy, and without any molecular collision.6)The transfer of energy leads to a reduction in the donor’s fluorescence intensity and excited state lifetime, and an increase in the acceptor’s emission intensity.

5.

6. The molecular processes underlying FRETa) Absorption of energy by the donor molecule, resulting in excitation from the ground state, S0D, to an excited singlet state, S1D. b) Several excited states are available to the donor; however, vibrational relaxation to S1D by internal conversion is rapid, ensuring that a majority of emission occurs from this state. c) Several fates are possible for the excited donor, including spontaneous emission and non-radiative processes. d) If a suitable acceptor fluorophore is nearby, then non-radiative energy transfer between the donor and acceptor can occur. e) This transfer involves a resonance between the singlet-singlet electronic transitions of the two fluorophores, generated by coupling of the emission transition dipole moment of the donor and the absorption transition dipole moment of the acceptor. f) Thus, the efficiency of FRET and the range of distances over which it can be observed are determined by the spectral properties of a given donor-acceptor pair.

7.

8. The primary conditions that need to be met in order for FRET to occur are relatively few:1) The donor and acceptor molecules must be in close proximity to one another (typically 10-100 Å). 2) The absorption or excitation spectrum of the acceptor must overlap the fluorescence emission spectrum of the donor. 3) The degree to which they overlap is referred to as the spectral overlap integral (J). 4) The donor and acceptor transition dipole orientations must be approximately parallel.

9. FRET can be experimentally measured in a number of ways:2) time-resolved 1) steady-statemost commonly employed methods for quantifying FRET: 1) reduction in the donor quantum yield in the presence of acceptor 2) enhancement of acceptor emission in the presence of donor

10. Quantum mechanics dictates that the rate of energy transfer correlates with the inverse sixth power of the distance separating the fluorophores, R. In the context of steady-state experiments, this relationship allows the efficiency of energy transfer, E, to be translated into relative distances.Förster, demonstrated that the efficiency of the process (E) depends on the inverse sixth-distance between donor and acceptor. Eq. 1

11. R0 is the Förster distance at which half the energy is transferred and R is the actual distance between donor and acceptor. The magnitude of the R0 is dependent on the spectral properties of the donor and the acceptor.

12. The Förster distance (R0) is dependant on a number of factors:1) The fluorescence quantum yield of the donor in the absence of acceptor (ΦD).2) The refractive index of the solution (n).3) The dipole angular orientation of each molecule (Κ2).4) The spectral overlap integral of the donor and acceptor (J).Eq. 2(in Å)(in cm)

13. Κ2 is the orientation factor between donor and acceptor, here assumed to be 2/3, although this value applies strictly only in the case of rapid (relative to the excited state lifetime) and isotropic rotational reorientation of the donor and acceptor.If the value is not known, it becomes very hard to extract distances from FRET efficiencies.Κ2 can take values between 0 and 4. However, if at least one fluorophore is flexible, so that it experiences many orientations during the lifetime of the excited state, then Κ2 should average to 2/3.

14. An example of the effect of distance on the efficiency of energy transfer:Arbitrary numbers for the Förster distance (R0) and the actual distance (R). If R0 is arbitrarily set to 1 (R0 = 1),and the distance between the donor and acceptor is also equal to 1.Then R = R0and the equation for efficiency is: E =16/(16 + 16) = 0.5 (i.e. 50%). (This half maximal value is what the Förster distance is defined as being.)If the distance is 10 x closer (e.g. R = 0.1 R0) then E = 16/(16 + 0.16) = 0.999999 (considerably more efficient)However, if the distance between the donor and the acceptor is 10 x further away (i.e. R = 10 R0) then E = 16/(16 + 106) = 0.0000001 (considerably less efficient)This extreme sensitivity for distance is what allows FRET to be used for proximity experiments.

15. However!

16. An important concern in regards to detection of FRET involves analyte concentration.Only those molecules that interact with one another will result in FRET.If large amounts of donor and acceptor molecules are present, but do not interact, the amount of FRET taking place would be quite low.With regards to FRET, the actual “analyte” being measured are donor/acceptor pairs rather than the individual components.Additionally, both the donor and acceptor molecules need to be in sufficient concentration in order for FRET to take place.Most binding events are a dynamic process that reaches a steady state. If one of the components of the reaction is in short supply then the total amount bound will be naturally low.Considerations for experiment design

17. Few words about the spectral overlap, JEq. 3where FλD is the normalized donor fluorescence emission spectrum and ελA is the wavelength-dependent molar extinction coefficient (M-1 cm-1) of the acceptor.Fortunately! you don’t have to calculate it.Spectral overlaps for many FRET pairs are widely available in the literature.

18. The apparent FRET efficiency is calculated as:Eq. 4where IA and ID represent acceptor and donor intensities, respectively.Eapp provides only an approximate indicator of the inter-dye distance because of uncertainty in the orientation factor Κ2 between the two fluorophores and the required instrumental corrections.As a rule of thumb, if fluorescence anisotropy, r, of both fluorophores is less than 0.2, Κ2 is close to 2/3.

19. To determine actual FRET efficiency, one has to determine the correction factor, γ, which accounts for the differences in quantum yield and detection efficiency between the donor and the acceptor.γ is calculated as the ratio of change in the acceptor emission intensity, ∆IA to change in the donor emission intensity, ∆ID upon acceptor photobleaching:Eq. 5Corrected FRET efficiency is then calculated using the expression:Eq. 6

20. FRET can be used as either a quantitative tool for determining absolute distances in macromolecular assemblies or for quantitative measure of relative distances. Given the dimensions of natural macromolecules, it is good to choose a fluorophore pair that allows measurements up to 70 Å or more, requiring an R0 of 55 Å or greater.The spectral overlap integral for Cy3–Cy5 isgiving R0 = 60.1 Å.Thus, E falls from 0.8 to 0.2 over the distance R = 44–70 Å. This is a very useful size range.

21. FRET efficiency can be measured from the quenching of the donor, or the enhanced emission from the acceptor.It can also be measured from the depolarization of the acceptor fluorescence.But of these the most sensitive method is to measure acceptor emission.Clegg’s normalized acceptor ratio is the most straightforward means to extract E, requiring a minimal number of samples.

22. Measurement and correction of FRET:1) The fluorescence intensity (F) of a sample containing only the donor (D) at molar concentration (C) is measured at the emission wavelength of the acceptor (A) and excitation wavelength of the donor:2) The fluorescence intensity of a sample containing both the donor and the acceptor (DA) at concentration C is measured at the emission wavelength of the acceptor and excitation wavelength of the donor:

23. 3) In order separate the emission component of the donor from the total FRET (FFRET) the corrected acceptor FRET is calculated by subtracting step 1 from step 2:4) If the acceptor can be excited at a wavelength that does not overlap the donor excitation spectrum then the fluorescence intensity of a sample containing both the donor and the acceptor at concentration C is measured at the emission wavelength of the acceptor and excitation wavelength of the acceptor:

24. 5) Normalization of the FRET signal is achieved by dividing step 3 by step 4 to give the following ratio:6) The ratio in 5 is used to calculate E in the following formula:d is the molar fraction of the labeled donor (labeled to total donor concentration) and under ideal experimental conditions is equal or close to 1.E is the FRET efficiencyis the acceptor extinction coefficient at the donor excitation wavelength (normally the absorbance of the acceptor at the donor excitation wavelength is very low making the second term in the square brackets close to zero

25. and are the fluorescence quantum yields of the acceptor at two different emission wavelength (Normally the FRET emission and acceptor emission (step 4) are measured at the same emission wavelength).Provided the shape of the FRET emission spectrum corresponds to the standard acceptor spectrum then and are the same and this ratio equals 1. If there are large deviations in the FRET emission spectrum from the standard acceptor emission spectrum this is indicative of strong coupling between the donor and acceptor; that is, the presence of the donor affects the energy levels of the acceptor, and FRET cannot be applied.

26. Suddenly equation 6 becomes very simple:The calculated E from step 6 is then applied to Eq. 1 and R (the distance between D and A) is calculated.

27. A working example(Marek Tyl and Joseph Maman)Chaperon exchange of H3-H4 dimer

28.