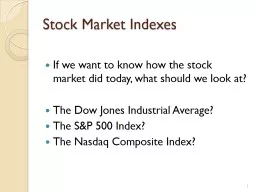
/
Stock Market Indexes If we want to know how the stock market did today, what should we Stock Market Indexes If we want to know how the stock market did today, what should we

Stock Market Indexes If we want to know how the stock market did today, what should we - PowerPoint Presentation

blastoracle
blastoracle . @blastoracle
Follow
344 views
Uploaded On 2020-06-23

Stock Market Indexes If we want to know how the stock market did today, what should we - PPT Presentation

The Dow Jones Industrial Average The SampP 500 Index The Nasdaq Composite Index 1 What We Need to Know to Understand an Index The number of stocks in the index The types of stocks in the index ID: 784413

000 index price 100 index 000 100 price stock stocks day market indexes weighted amp weighting dow 110 change

Share:

Link:

Embed:

Download Presentation from below link

Download The PPT/PDF document "Stock Market Indexes If we want to know ..." is the property of its rightful owner. Permission is granted to download and print the materials on this web site for personal, non-commercial use only, and to display it on your personal computer provided you do not modify the materials and that you retain all copyright notices contained in the materials. By downloading content from our website, you accept the terms of this agreement.


Presentation Transcript

Slide1

Stock Market Indexes

If we want to know how the stock market did today, what should we look at?The Dow Jones Industrial Average?The S&P 500 Index?The Nasdaq Composite Index?

1

Slide2

What We Need to Know

to Understand an IndexThe number of stocks in the index.The types of stocks in the index.The weighting method used to calculate the index value.

2

Slide3

Price

WeightingStart by calculating the average price (arithmeticmean) of the stocks in the index at time t N

Index value

t

=

 P

i,t

divided by N i = 1 where the stocks in the index at time t go from 1 – N

3

Slide4

Price Weighting: An Example

Price Price Stock Day 1 Day 2 Shrs Out.

A $100 $110 100,000

B $ 10 $ 10 1,000,000

Note that the market cap of each stock is $10 million on Day 1

4

Slide5

Price Weighting: An Example

Index Value1 = (100 + 10)/2 = 55Index Value2 = (110 + 10)/2 = 60

% Change Index = (60 - 55)/55 = 9.1%

A 10% increase in the price of stock A caused a 9.1% increase in the index.

5

Slide6

What if Instead...

Price PriceStock Day 1 Day 2 Shares Out. A $100 $100 100,000

B $ 10 $ 11 1,000,000

6

Slide7

Example (cont.)

Index Value1 = (100 + 10)/2 = 55Index Value2 = (100 + 11)/2 = 55.5

% Change in Index = (55.5 - 55)/55 = .91%

A 10% increase in the price of stock B caused a 0.91% increase in the index.

7

Slide8

Price

Weighting Stock A’s Price is 10 times higher so it gets a 10 times larger weighting. But both companies are the same size.Stock prices can be altered by changing shares outstanding through splits and repurchases

8

Slide9

Price Weighting: Another Example

Price Price Stock Day 1 Day 2 Shares Out A $100 $ 55 200,000

B $ 10 $ 10 1,000,000

Price of Stock A goes up to $110 on day 2, and at the close of trading, it has a 2-for-1 stock split, cutting the price in half while doubling the shares outstanding

9

Slide10

Price Weighting Index

Index Value1 = (100 + 10)/2 = 55Index Value2 = (55 + 10)/2 = 32.5% Change = (32.5 - 55)/55 = - 40.9%

The index is down, but stock A gained 10% and stock B was unchanged.

10

Slide11

The Solution: Adjust the Divisor

Adjust the Divisor so that the index gives us the value it would have had without the split:Before the Split, the index would have been: 110 + 10 = 120 and 120/2 = 60

After the Split, sum of prices Day 2 = 55 +10 = 65 65/(adjusted divisor) = 60

Adjusted Divisor = 1.083333

11

Slide12

The Adjusted Divisor

From now on, we need to add the prices of the stocks in the index and divide by the adjusted divisor to get the index value. We continue to use this adjusted divisor until another stock splits, or until one of the stocks in the index is replaced, or if there is a spin-off or an acquisition that alters the stock’s price.

12

Slide13

Price Weighting

Do any major indexes use a Price Weighting System? YesThe Dow Jones Industrial Average does

13

Slide14

DJIA: History

http://www.djindexes.com Oldest barometer of the stock market.Price Weighted IndexStarted in 1896 by Charles Dow with 12 stocks. (He and Jones started Dow Jones & Company.)

GE

was the last original

stock

in

the index.

14

Slide15

DJIA: Composition

Today, there are 30 Companies. Represent about 30% of the market value of U.S. Stocks25 stocks trade on the NYSE5

stocks (AAPL, MSFT, INTC

, WBA,

and CSCO) trade on NASDAQ

15

Slide16

DJIA: Composition

As of Aug. 1, 2018:3M, Nike, American Express, Apple, Merck, Goldman Sachs, Boeing, Caterpillar, Chevron, Cisco, Coca-Cola, DuPont, ExxonMobil, Wallgreens, Visa, Home Depot, Intel, IBM, Johnson & Johnson, JP Morgan Chase, United Healthcare, McDonald’s, Microsoft, Pfizer, Procter & Gamble, Travelers, United Technologies, Verizon, Wal-Mart, Disney

16

Slide17

DJIA: Composition

Editors of the Dow Jones-owned WSJ select the stocks. Dow Jones is now a subsidiary of News Corp.What are their current prices?http://money.cnn.com/data/dow30/

17

Slide18

Other Dow Jones

Price Weighted IndexesTransportation (20 firms)Started in 1884Utilities (15 firms)Started in 1929

Composite (65 firms)

Stocks in the Industrial, Transportation and Utilities indexes

18

Slide19

DJIA:

Index ValueSuppose the Dow closes at 24,589.50How did they arrive at this value?

30

P

i,t i = 1DJIA Indext

=

---------------------

Adj. Divisor

19

Slide20

Market Cap Weighted Indexes

Market Capitalization = Market Value DEFINITION:

#shares outstanding X Price per Share

20

Slide21

Index Value t

n  (P i,t )

x (#Out Shrs

i,t

)

i = 1

Indext = ----------------------------- X Base n Value 

(

P

i,b

) X (#Out shrs

i,b

)

i = 1

21

Slide22

Index Value t

t indexes daysb is the base dayi indexes stocksBase day value needs to be arbitrarily set to something by the firm starting the index. 10 or 100 are common.

22

Slide23

Back to Example: Case 1

Price PriceStock Day 1 Day 2 Shares Out. A $100 $110 100,000 B $ 10 $ 10 1,000,000

Again, note that each stock has the same market value on day 1

23

Slide24

Market Value Example – Day 1

Index Value1 =(100)(100,000) + (10)(1,000,000)----------------------------------------- X 100

(100)(100,000) + (10)(1,000,000)

= 100

24

Slide25

Market Value Example – Day 2

Index Value2 =(110)(100,000) + (10)(1,000,000)----------------------------------------- X 100

(100)(100,000) + (10)(1,000,000)

= 105

25

Slide26

Market Value Example

% Change = (105 - 100)/100 = 5.0%NOTE: a10% increase in Stock A caused a 5% increase in the index.

26

Slide27

What if Instead…Case 2

Price Price SharesStock Day 1 Day 2 Outstanding A $100 $100 100,000 B $ 10 $ 11 1,000,000

Instead of stock A going up by 10%, stock B does

27

Slide28

Example (cont)

Index Value2 =(100)(100,000) + (11)(1,000,000)----------------------------------------- X 100(100)(100,000) + (10)(1,000,000)

= 105

28

Slide29

What if a stock splits?

Price Price Stock Day 1 Day 2 Shrs Out A $100 $ 55 200,000 B $ 10 $ 10 1,000,000

Stock A goes up to $110 and then has a 2-for-1 split at the close of Day 2

29

Slide30

Market Value Example

Index Value2 =(55)(200,000) + (10)(1,000,000)----------------------------------------- X 100(100)(100,000) + (10)(1,000,000)

= 105

30

Slide31

Market Value Example

% Change = (105 - 100)/100 = 5.0%Since stocks A and B have the same market value, they receive the same weight in the indexWhat indexes use this weighting system?

31

Slide32

S&P 500

http://money.cnn.com/data/markets/sandp/Most famous market-value weighed index

Technically a float-weighted index

How many stocks are in the index?

32

Slide33

S&P 500

1928 was S&P 90. In 1957 it became S&P 500.Is used by 97% of U.S. money managers and pension plan sponsors as a proxy for the U.S. stock market.33

Slide34

S&P 500

Stocks are selected to include leading companies in leading industries in the U.S.U.S. firms onlyChanges are made every few weeks Standard and Poors (a division of McGraw-Hill) decides which companies to include in the index

34

Slide35

Other MV Weighted Indexes

NYSE Composite: All NYSE stocks NASDAQ Composite: All stocks listed on NASDAQ (Roughly 3,000 stocks) Wilshire 5000: All stocks traded in the United States

35

Slide36

Other MV Weighted Indexes

Wilshire 4500: Wilshire 5000 stocks with the S&P 500 stocks removed.S&P 400: A mid-cap indexS&P 600: A small-cap index36

Slide37

Other MV Weighted Indexes

Russell Indexes: U.S. Stocks from NYSE, AMEX, and Nasdaqhttp://www.russell.com/indexes Russell 3000: 3000 largest U.S. firms

Russell 2000

: 2000 smallest of Russell 3000

Russell 1000

: 1000 largest of Russell 3000

37

Slide38

International Indexes

International Equity Indexes:MSCI World Index: 1600 stocks from 23 countriesMarket-value weightedDoes not include emerging marketsGlobal Dow: 150 stocks; both developed and emerging countries (but 40% from U.S.); equally-weighted

38

Slide39

Equally-weighted Indexes

Each stock receives the same weight. Indexes done either with arithmetic or geometric averages of % changes in stock prices.

39

Slide40

Back to Example: Case 1

Price PriceStock Day 1 Day 2 Shares Out. A $100 $110 100,000 B $ 10 $ 10 1,000,000

40

Slide41

Example

Stock A increased 10% in price and Stock B had a price change of 0%.Assume a starting index value of 100 on day 1, so Index Value1 = 10041

Slide42

Example

Using Arithmetic Mean:Average % Change = (10+0)/2 = 5%Since the stocks in the index went up by an average of 5%, the index must go up by 5%Index Value2 = 100 X 1.05 = 105

Used in academic studies

42

Slide43

Example

Using Geometric Mean:Average % Change [(1.10)(1.0)]1/2 - 1 = 4.88%

Index Value

2

= 100 X 1.0488 = 104.88

Used by Value Line

43

Slide44

Index Fund Formation

Price Weighted: Equal number of shares of each stockMarket Value Weighted: Invest in proportion to market capitalization.Equally-weighted: Equal dollar amount in each stock

44

Slide45

Implications of Skewness

Suppose there are only 4 stocks in our index: W, X, Y & Z


W has a 300% return

X has a 25% return

Y has a 5% return

Z has a - 20% return

45

Slide46

Implications of

SkewnessWhat if we have an equally-weighted index?Index Return:

.25(300%) + .25(25%) + .25(5%) + .25(-20%) = 77.5%


The “typical” stock in your index was not up 77.5%

The outstanding performance of W drove the results


46

Slide47

Implications of Skewness

 Many indexes have skewed returns 

  Often get a narrow market.

Strong returns for an index may be primarily due to one or two industries

47

Slide48

Implications of

Skewness For any price-weighted or value-weighted index, as a stock’s price goes up (relative to other stocks) it receives a higher weighting in the index.

This means that if there is a “bubble” in one sector, the index will tilt more heavily toward the stocks in that sector.

For those who invest in the index, it means placing a greater weight on those stocks which have gone up in price the most.

Is that good or bad???

48