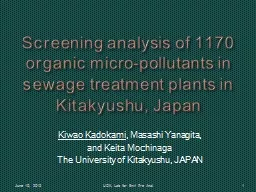
/
Screening analysis of 1170 organic micro-pollutants in sewage treatment plants in Kitakyushu, Screening analysis of 1170 organic micro-pollutants in sewage treatment plants in Kitakyushu,

Screening analysis of 1170 organic micro-pollutants in sewage treatment plants in Kitakyushu, - PowerPoint Presentation

blondield
blondield . @blondield
Follow
342 views
Uploaded On 2020-08-27

Screening analysis of 1170 organic micro-pollutants in sewage treatment plants in Kitakyushu, - PPT Presentation

Japan Kiwao Kadokami Masashi Yanagita a nd Keita Mochinaga The University of Kitakyushu JAPAN June 10 2015 UOK Lab for Envi Pre Anal 1 Todays Contents Background Introduction of Kitakyushu City ID: 804930

pre lab anal envi lab pre envi anal 2015 chemicals june uok substances 2015uok pst treatment fst method detected

Share:

Link:

Embed:

Download Presentation from below link

Download The PPT/PDF document "Screening analysis of 1170 organic micro..." is the property of its rightful owner. Permission is granted to download and print the materials on this web site for personal, non-commercial use only, and to display it on your personal computer provided you do not modify the materials and that you retain all copyright notices contained in the materials. By downloading content from our website, you accept the terms of this agreement.


Presentation Transcript

Slide1

Screening analysis of 1170 organic micro-pollutants in sewage treatment plants in Kitakyushu, Japan

Kiwao Kadokami, Masashi Yanagita, and Keita MochinagaThe University of Kitakyushu, JAPAN

June 10, 2015

UOK, Lab for Envi Pre Anal

1

Slide2

Today’s Contents

BackgroundIntroduction of Kitakyushu CityAutomated Identification and Quantification System (AIQS) for GC-MS and LC-TOF-MSComprehensive analytical methods using two AIQSsObjectivesOutline of resultsMajor chemical groups detectedEmission amounts Change in concentrations during treatment processes

Risk evaluation

Conclusions

June 10, 2015

UOK, Lab for Envi Pre Anal

2

Slide3

Population:

957,597 (April 2015)Area: 487.89km

2

(Oct 2010)

GDP:

29.6 billion US$

(

2014)

Slide4

Major enterprises in the City

Mitsubishi Chemical Corporation

Nippon Steel

& Sumitomo Metal

TOTO LTD

Kyushu Electric Power Co.,Inc.

Toyota Motor Corporation

Nissan Motor Co., Ltd.

UOK, Lab for Envi Pre Anal

4

Slide5

Dawn of Industrial Modernization

in Kitakyushu

Yahata Steel Works (Japan’s first state-owned steel works)

began operation

in

1901.

June 10, 2015

UOK, Lab for Envi Pre Anal

5

Slide6

Overcoming Severe Pollution:

Kitakyushu’s Experience

1960s

Today

Slide7

Selected as OECD

Green Growth

Model City

Other cities selected include Paris, Chicago, Stockholm

L: Ms.

Yoshie

Nakatani

(Director, OECD Tokyo

); R: Mayor of Kitakyushu

Slide8

waste

Garbage incinerator

Commute, leisure

Transportation

Standard homes

products

Chemical plants

Processing plants

Mine, oil mine

Fields

Offices

Factories , work shops

use

use

use

use

use

use

waste

cosmetics

pesticides

(paradichlorobenzene)

(LAS)

antibacterial agent

(glutamic sodium)

(nylon)

(vinyl acetate)

(benzene)

(toluene)

(trichlorethylene)

(tetrachloroethylene)

(organophosphorus

agents)

(fine ceramics

(polyethylene)

(polyvinyl chloride)

(polyester)

(ester)

Raw materials

Intermediates

Chemicals are

Indispensable

M

aterials

for

Modern

S

ociety

June 10, 2015

UOK, Lab for

Envi

Pre Anal

8

Slide9

Chemicals Existing in the Aquatic Environment in JapanThe Nation-wide survey by Ministry of the Environment, Japan shows that a large number of chemicals pollute the environment.More than thousands chemicals including unintentionally created chemicals seem to exist in the aquatic environment.

9Summary of results from 1974 to 2013.WaterSediment

Fish

Air

Diet

Others

Total

Chemicals Surveyed

1095

1026

473

455

27

26

1250

Chemicals Detected

391

470

288

322

21

13

705

Detection Ratio, %

3646

61

71

78

50

56

Highly efficient analytical methods are necessary.

In order to examine pollution by chemicals, we have to measure as many substances as possible.

June 10, 2015

UOK, Lab for

Envi

Pre Anal

Slide10

Instruments for Chemical Analysis

VolatileSemi-volatileNon-volatile

Polar

alcohols

ketones

carboxylic acids

alcohols

ketones

carboxylic acids

phenols

high molecular electrolytes carbohydrates

fulvic

acid

Semi-polar

ethers

esters

aldehydes

ethers

esters

aldehydes

epoxidesheterocyclic compoundsproteincarbohydrateshumic acids

Non-polaraliphatic compoundsaromatic compoundsaliphatic compoundsaromatic compoundsalicyclic compounds

non-ionic polymerslignin

Small

MediumLarge10

GC-MS

Derivatization

LC-MS

June 10, 2015

UOK, Lab for Envi Pre Anal

Slide11

Automated Identification and Quantification System (AIQS) for GC-MSandComprehensive Analytical Method for SVOCsJune 10, 2015

UOK, Lab for Envi Pre Anal11

Slide12

What is AIQS?

Data Registered in AIQS12

Mass spectra

Retention times

(PTRI)

Calibration curves

(

IS)

Results

A

utomated

I

dentification

and

Q

uantification

S

ystem with a

D

ata

BaseJune 10, 2015UOK, Lab for Envi Pre AnalNo use standard substancesReduce time, cost and waste Simultaneous measurement

Slide13

13GC-MS

 : GC-Quadrupole MS 

[GC]


Column


J&W

DB-5 MS (30 m×0.25 mm

i.d

, 0.25 µm film)

Column oven temp.

40

℃(2 min) - 8 ℃/min - 310 ℃(5 min) Injection temp.: 250 ℃ 

    Injection mode: Splitless, 1 min for purge-off time 

 Carrier gas

: He 

    Linear velocity: 40 cm/s, constant flow mode  

[MS]


Interface temp.

300


Ion source temp.

200


Ionization method

: EI


Tuning method

Target

tuning for US EPA method 625

 Measurement method: SIM/Scan (m/z 45 to 600) 


 GC-MS Conditions June 10, 2015UOK, Lab for Envi Pre Anal

Slide14

Measurement Procedures by AIQSJune 10, 2015UOK, Lab for Envi Pre Anal

14Measure sample

Calculate RT

Compare RT and mass to standard

Calcurate

amount

Exist?

Last

Start

END

YES

YES

NO

NO

Next

Analytical data

Available as commercial product

Pretreatment

Measure CS

Database (RT, Mass and Cal)

No use standard substances

Reduce time, cost and waste

Simultaneous measurement

Slide15

Substances Registered in the AIQS 

Class 1NumberClass 2

Number

Chemicals consisting of C and H

195

PAHs

79

PCBs

62

Others

54

Chemicals consisting of C, H and O

150

Phenols

50

Others

100

Chemicals

containing N

113

Aromatic amines

43

Nitro compounds

42

Others

28

Chemicals containing S

12

12

Chemicals containing P

8

8

PPCPs

14

14

Pesticides

451

Insecticide

184

Herbicide

118

Fungicide

116

Others

33

Total

943

15

June 10, 2015

January 1, 2014

UOK, Lab for Envi Pre Anal

Slide16

Performance of AIQS for GC-MSJune 10, 2015UOK, Lab for Envi Pre Anal

16ItemPerformancePrediction of retention times (RT)Difference between actual and Predicted RT is less than 3 s.Measurement reproducibilityReproducibility (RSD) of 78% of the registered compounds is below 20%.Instrumental detection limit (IDL)IDL of 86% of the registered compounds is below 10 pg (scan mode).

J. Chromatogr A, 1089 pp219-226, 2005.

Bunseki, 60, pp543-556. 2011.

Slide17

Flowchart of SVOCs Analysis

17June 10, 2015UOK, Lab for Envi Pre Anal

Slide18

Development of Analytical Methods for Water Samples using Model CompoundsJune 10, 2015

n-AlkanesAliphatic acid estersAlcohols

Phthalates

Ethers

Phosphate esters

Benzenes

Organochlorine pesticides

Biphenyls

Organophosphorus pesticides

Nitrobenzenes

Carbamate pesticides

Polycyclic aromatic

hydrocarbons (PAH)

Carbamide pesticides

Nitro-PAHs

Acid aminde pesticide

Heterocyclics

Triazine pesticide

Phenols

Dinitroaniline pesticide

Nitrophenols

Diphenylether pesticide

Amines

Pyrethroid type pesticide

Aromatic amines

Other pesticides

Sulfonate


57 groups, 202 compounds

b

p

: 145

536

,

logPow

: -0.65

15.07

18

UOK, Lab for Envi Pre Anal

Slide19

Recoveries by LLE with CH2Cl2June 10, 2015

19UOK, Lab for Envi Pre AnalBar shows 95% confidence interval of average. J. Environ. Chem, 19, pp351-360, 2009.Anal. Sci., 29, pp483-486, 2013.

Slide20

Method Detection Limit of Water, ng/l

Compounds GC-MS TIMGC-MS SIM

GC-MS-MS

PAHs

10

1

-

Sterols

32-320

8-320

-

PCBs

1.6-40

0.4-1.6

0.4-1.6

Pesticides

20

2

0.1-16

Others

5-500

-

-

20

June 10, 2015UOK, Lab for Envi Pre Anal

Slide21

AIQS and Comprehensive Method for Polar Chemicals using LC/TOF-MS21June 10, 2015

UOK, Lab for Envi Pre Anal

Slide22

LC-TOF-MS Conditions

LCAgilent 1200ColumnGL Science ODS-4 HP (150mm, 2.1mm, 3µm)Column temp.40℃Flow rate

0.3mL/min

Mobile phase

A: 5mM CH

3

COONH

4

in H

2

O

B: 5mM CH

3

COONH

4

in CH

3

OH

Gradient profile

Time[min]03050B[%]59595

MSAgilent 6220 Time of Flight LC/MSIonizationESI-positiveMeasurement modeScan Scan range

50-1000Reference ion m/z=121.050873,922.009798Drying gas 10L/min at 325℃Nebulizer gas pressure50psiVcap voltage

3500V Fragmentor voltage

100V (100, 150, 200 and 250V)

22June 10, 2015UOK, Lab for Envi Pre Anal

Slide23

PPCPs: Pharmaceutical and Personal Care Products

ClassNumberExampleIndustrial chemicals6Flame retardant, etc.PPCPs95Antibiotic, Analgesic, etc.Pesticides207Fungicide, Herbicide,

etc.Total

308


Substances Registered in AIQS

for LC-TOF-MS

23

June 10, 2015

UOK, Lab for Envi Pre Anal

Slide24

Identification PerformanceCorrect identification can be done using both RT and exact mass (mass resolution = 10000).In addition, target screening of a large number of substances is possible by using in-source fragment ions.

June 10, 2015UOK, Lab for Envi Pre Anal24TICCISTargetFragment ions

Target

Slide25

Flowchart of Polar Substances Analysis

25June 10, 2015UOK, Lab for Envi Pre AnalChemosphere, 122, pp125-130, 2015.

Slide26

Recoveries by SPE with PS-2+AC-2June 10, 2015

26UOK, Lab for Envi Pre AnalBar shows 95% confidence interval of average.Conc: 0.2 mg/L, n=7

Slide27

Spike amounts,

μgnAvg recovery, %AvgRSD, %

No of comp recovered > 70%

High Conc.

(0.5ppb)

100

8

81

(87)

13

102/126

Low Conc.

(0.1ppb)

20

8

75

(80)

2594/12614

※ Excluding comp over log Pow 4.5

Recovery Test

Slide28

Method Detection Limit of Water, ng/l

MDL, ng/LNo of comp2.5

55

(44

)

5.0

32 (25

)

10

23 (18

)

20

7 (6

)

50

6 (5%)100

3 (2

%)

The method can determine targets at ppt level in water.

15

Slide29

Objectives

To clarify the types and quantities of organic micro-pollutants (OMPs) discharged from domestic activitiesTo clarify emission amounts per capitaTo clarify treatment efficiency of STPs by the activated sludge methodTo clarify the types and quantities of OMPs discharged to the environment June 10, 2015UOK, Lab for Envi Pre Anal29

Slide30

Study Sewage Treatment Plants

https://www.city.kitakyushu.lg.jp/files/000096297.pdf30

Kitaminato STP

Treatment population

91,796

Treatment capacity

44,000m3/d

Hiagari

STP

Treatment population

34,7367

Treatment capacity

263,000m3/d

Shinmachi

STP

Treatment population

:102,151

Treatment capacity: 64,000m3/dKogasaki STPTreatment population:298,298Treatment capacity

:177,000m3/d

Sone

STPTreatment population:140,108Treatment capacity: 73,000m3/d

Sampling date: Oct 29, 2014

A sewerage coverage ratio in Kitakyushu is 99.8%.

Activated sludge treatment method

Slide31

https://www.city.kitakyushu.lg.jp/suidou/04600128.htmlSampling Points

Grit camberPrimary sedimentation tankFinal sedimentation tank

Activated sludge tank

Chlorine disinfection

Influent

Primary treatment water

Effluent

Sludge treatment facility

Sea

Drain

June 10, 2015

UOK, Lab for Envi Pre Anal

31

Slide32

ResultsJune 10, 2015UOK, Lab for Envi Pre Anal32

Slide33

Recovery of Surrogates, %33

GC-MS method, n=15Error bar is 95% CL.

Slide34

June 10, 2015

UOK, Lab for Envi Pre Anal34

Recovery of Surrogates, %

L

C-TOF-MS method, n=15

Recovery, %

Error bar is 95% CL.

Slide35

The number of detected substances and their concentrations at each STPJune 10, 2015UOK, Lab for Envi Pre Anal

35A-GC: After grid chamberA-PST:After primary sedimentation tankA-FST:After final sedimentation tank

Slide36

Concentrations (mg/L) of the chemicals found and the numbers of chemicals found

Target substanceInfluent(after grid chamber)Effluent(after final sedimentation tank)Removal ratio, %

Chemicals consisting of C and H (190)

36 (44)

0.39 (28)

98.9

Chemicals consisting of C, H, and O (159)

532 (37)

4.3 (22)

99.2

Chemicals containing N (118)

1.8 (3)

0.54 (4)

70

Chemicals containing S (12)

0.29 (2)

0.48 (3)

-65.5

Chemicals containing P (9)

0.47 (3)

0.27 (3)

42.6

Pharmaceuticals and personal care products (108)

95 (30)

11 (24)88.4Pesticides (574)0.11 (5)

0.11 (6)

0

Total (1170)

665 (124)

16.9

(90)

97.5

June 10, 2015

UOK, Lab for Envi Pre Anal

36

(Number of substances)

Slide37

The number of detected substances and their concentrations at each STP

NamePointNumber of detected compoundsTotal concentration, m

g/L

Sone

A-GC

115

786.7

A-PST

113

658.3

A-FST

68

15.9

Shinmachi

A-GC

106

755.9

A-PST

107

613.9

A-FST

67

19.7

Hiagari

A-GC111

585.3

A-PST

109

488.3

A-FST

72

17.9

Kitaminato

A-GC

108

648.8

A-PST

108

634.6

A-FST

64

19.8

Kogasaki

A-GC

101

550.0

A-PST

98

451.4

A-FST

57

11.1

June 10, 2015

UOK, Lab for Envi Pre Anal

37

A-GC:

After grid chamber

A-PST:

After primary sedimentation tank

A-FST:

After final sedimentation tank

Slide38

Substances detected at the 10 highest concentration in influents or effluents

NoInfluentEffluentCompoundConc, ug/LCompoundConc, ug/L

1

Cholesterol

136.6

Metformin

2.87

2

Coprostanol

64.1

Bis

(2-ethylhexyl)phthalate

1.96

3

2-Phenoxy-e

thanol

35.9

Cholesterol

1.95

4beta-Sitosterol35.4Crotamiton1.8453-&4-Methylphenol33.7

Azithromycin 1.056Epicoprostanol29.7Sulpiride0.987Campesterol

27.2Etodolac

0.6782-Butoxyethanol

23.2Coprostanol0.659L-Menthol21.0Diethyl phthalate0.6310Caffeine

20.1

Clarithromycin

0.59

June 10, 2015

UOK, Lab for Envi Pre Anal

38

Slide39

Drugs detected at the 10 highest concentration in influents or effluentsCompound

Conc. ug/LAmountkg/dClassAcetaminophen12.605.86 Analgesics/anti-inflammatorics

Metformin

12.16

5.98

Antidiabetics

Etodolac

6.01

2.81

Analgesics/anti-

inflammatorics

Azithromycin

3.36

1.46

Antibiotics


Theophylline

2.85

1.37

B

ronchodilatorBezafibrate2.661.36 Lipid regulatorsCrotamiton2.240.94

Anti-itch medicationIbuprofen1.790.55 Analgesics/anti-inflammatoricsKetoprofen1.610.67

Analgesics/anti-inflammatoricsClarithromycin

0.860.39

AntibioticsJune 10, 2015UOK, Lab for Envi Pre Anal39CompoundConc. ug/LAmountkg/dClass

Metformin

2.87

1.10

Antidiabetics

Crotamiton

1.84

0.79

Anti-itch medication

Azithromycin

1.05

0.45

Antibiotics

Sulpiride

0.98

0.42

Antidepressant

Etodolac

0.67

0.27

Analgesics/anti-

inflammatorics

Clarithromycin

0.59

0.26

Antibiotics

Lidocaine

0.49

0.21

Local anesthetic


Sulfamethoxazole

0.31

0.17

Antibiotics

Atenolol

0.37

0.15

Beta-blockersBezafibrate0.300.14Lipid regulatorsInfluentEffluent

Concentration is the average of the 5 STPs.

Amount is the sum of the 5 STPs.

Slide40

Quantities of the detected substances at each sampling point

NamePointAll substances, kg/dayPPCPs, kg/dayWater volume, ton/day

Sone

A-GC

37.7

5.32

47,964

A-PST

31.6

4.38

A-FST

0.76

0.52

Shinmachi

A-GC

34.3

4.75

45,413

A-PST

27.9

4.53

A-FST

0.90

0.48

Hiagari

A-GC

106.2

18.2

181,388

A-PST

88.6

16.6

A-FST

3.25

1.83

Kitaminato

A-GC

25.8

3.29

39,706

A-PST

25.2

3.61

A-FST

0.79

0.57

Kogasaki

A-GC

75.5

10.5

137,217

A-PST

61.9

10.4

A-FST

1.52

1.10

Whole city

A-GC

279.5

42.1

451,688

A-PST

235.2

39.5A-FST7.224.50June 10, 2015UOK, Lab for Envi Pre Anal40A-GC:

After grid chamberA-PST:After primary sedimentation tankA-FST:After final sedimentation tank

Slide41

Per capita daily discharged quantities of the detected substances

Amounts, mg/capita/dayAll substancesPPCPsInfluent29244Effluent7.54.7June 10, 2015UOK, Lab for Envi Pre Anal41

Slide42

Low removal substances and substances whose concentrations in effluent are higher than in influentSubstance

STP1,2,3-Trimethoxybenzene5/52,6-Di-tert-butyl-4-benzoquinone5/5

2-Methylaniline

5/5

Sulfamethoxazole

5/5

Sulpiride

5/5

Candesartan

5/5

Carbamazepin

5/5

1,3-Dicyclohexylurea

4/5

Roxithromycin

4/5

Carbendazim

4/5

Diuron

4/5Anthraquinone3/5n-C25H522/5n-C26H54

2/5

2(3H)-Benzothiazolone2/5

2-(Methylthio)-benzothiazol2/5Tris(2-chloroethyl) phosphate2/5Dicyclohexylamine2/5

Sulfapyridine

2/5

June 10, 2015

UOK, Lab for Envi Pre Anal

42

Effluent

conc

> Influent

conc

Slide43

Compounds detected over PNEC

(Ratio of MEC to PNEC)June 10, 2015UOK, Lab for Envi Pre Anal43Compound

Sulfamethoxazole

Clarithromycin

Azithromycin

Max

19.9

11.8

9.3

Min

6.1

6.4

4.8

Average

11.6

8.4

7.0

PNEC*,

m

g/L

0.027

0.07

0.15

* Sci Total Environ, 429, pp123-155, 2012.

Slide44

Conclusions

133 out of 1170 analytes with 665 mg/L were detected in influents. Detected substances were comprised of sterols, PPCPs, phenols, phthalates and PAHs.Emission quantities of all analytes and PPCPs are 292 and 44 mg/capita/day, respectively.Activated sludge method can remove over 97% of the detected substances except for PPCPs and organophosphorus flame

retardants.

7.22 kg of

analytes

and 4.50 kg of PPCPs were discharged from the STPs to the aquatic environment. Several PPCPs have a potential to give adverse effects on aquatic organisms.

June 10, 2015

UOK, Lab for Envi Pre Anal

44

Slide45

Thanks for your attention!!