PPT-Calculate t-statistic 19.16
Author : briana-ranney | Published Date : 2018-10-21
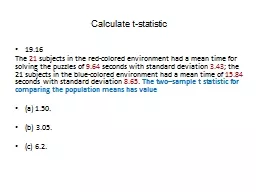
The 21 subjects in the redcolored environment had a mean time for solving the puzzles of 964 seconds with standard deviation 343 the 21 subjects in the bluecolored
Presentation Embed Code
Download Presentation
Download Presentation The PPT/PDF document "Calculate t-statistic 19.16" is the property of its rightful owner. Permission is granted to download and print the materials on this website for personal, non-commercial use only, and to display it on your personal computer provided you do not modify the materials and that you retain all copyright notices contained in the materials. By downloading content from our website, you accept the terms of this agreement.
Calculate t-statistic 19.16: Transcript
Download Rules Of Document
"Calculate t-statistic 19.16"The content belongs to its owner. You may download and print it for personal use, without modification, and keep all copyright notices. By downloading, you agree to these terms.
Related Documents