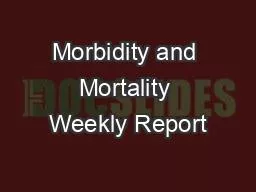
/
Centers for Disease Control and Prevention Centers for Disease Control and Prevention

Centers for Disease Control and Prevention - PDF document

briana-ranney
briana-ranney . @briana-ranney
Follow
471 views
Uploaded On 2016-08-25

Centers for Disease Control and Prevention - PPT Presentation

Oce of the Director CDC Winnable Battles 20102015 Progress Report 2014 CS254894 2 EXECUTIVE SUMMARY An update to the rst CDC Winnable Battles Progress Report released in November 2013 this docume ID: 456068

Oce the Director CDC Winnable

Share:

Link:

Embed:

Download Presentation from below link

Download Pdf The PPT/PDF document "Centers for Disease Control and Preventi..." is the property of its rightful owner. Permission is granted to download and print the materials on this web site for personal, non-commercial use only, and to display it on your personal computer provided you do not modify the materials and that you retain all copyright notices contained in the materials. By downloading content from our website, you accept the terms of this agreement.


Presentation Transcript

Centers for Disease Control and Prevention Oce of the Director CDC Winnable Battles 2010-2015 Progress Report 2014 CS254894 2 EXECUTIVE SUMMARY An update to the rst CDC Winnable Battles Progress Report released in November 2013, this document captures recent data and contributions across each CDC Winnable Battle: Tobacco, Nutrition / Physical Activity / Obesity, Food Safety, Healthcare-Associated Infections, Motor Vehicle Injuries, Teen Pregnancy, and HIV. CDC Winnable Battles utilize evidence-based, cost-eective strategies to tackle specic health challenges working together with partners in public health. Notable in this update is the continued progress of several Winnable Battles. Teen birth rates continue to fall. Fatalities due to motor vehicle crashes are fewer. The percentage of adults who smoke is decreasing, and the percent of youth who smoke has declined past the 2015 Winnable Battles target. Some healthcare-associated infections, including methicillin-resistant Staphylococcus aureus (MRSA) and central line-associated blood stream infections (CLABSI) have declined. And, the percent of people living with HIV who know their status is increasing. Rates of breastfeeding, which helps protect against childhood obesity and other illnesses, continue to climb. While not yet evident in the data, indications of progress are emerging in other areas as well. Better, more focused use of food safety data to inform agencies who have oversight of food industries is poised to help prevent foodborne illness and outbreaks. Despite these gains, much work remains. For instance, new potential health threats such as e-cigarettes are emerging and need evaluation to determine how they may aect our health. Together with our partners, we are having a positive impact on health by focusing on what works now. We’ve made progress in most areas, but still have more to do to meet our 2015 goals. The Winnable Battles were chosen based on the magnitude of the health problems and the ability of CDC and its public health partners to make signicant progress to improve outcomes. There are evidence-based strategies available now to address the critical health challenges presented by each of the Winnable Battles areas. By continuing to work closely with our public health partners and educating stakeholders about these evidence-based strategies, we can achieve our Winnable Battles goals. TOBACCO NUTRITION, PHYSICAL ACTIVITY, OBESITY & FOOD SAFETY HEALTHCAREASSOCIATED INFECTIONS MOTOR VEHICLE SAFETY TEEN PREGNANCY HIV 3 TARGETS A comprehensive set of indicators establishes baselines and targets for all Winnable Battle areas. These indicators help us measure the impact of programs and policies on our nation’s health, and support the Department of Health and Human Services’ strategic plan and other priorities. Derived from Healthy People 2020 and other established measures, the related targets are ambitious yet achievable, evidence-based, and specic to the priorities and opportunities within each of these health areas. This dashboard gives a snapshot of each indicator by comparing recent data trends to the 2015 Winnable Battle targets. Red = Not on track to reach 2015 target Yellow = Progress is being made, but overall progress is limited or slow Green = On track to reach 2015 target Green Checkmark= Exceeded 2015 target 2015 Targets Progress Tobacco empty cell Decrease the percent of adults who smoke cigarettes by 17.5% On track to reach 2015 target Decrease the percent of youth who smoke cigarettes by 12% Exceeded 2015 target Increase the proportion of the U.S. population covered by smoke-free laws by 59% Progress is being made, but overall progress is limited or slow Nutrition, Physical Activity, and Obesity empty cell Reduce the proportion of children and adolescents age 2-19 who are obese by 8% Progress is being made, but overall progress is limited or slow Increase the proportion of infants who are breastfed at 6 months by 35% Progress is being made, but overall progress is limited or slow Food Safety empty cell Reduce foodborne illness caused by Salmonella by 14.5% Progress is being made, but overall progress is limited or slow Reduce foodborne illness caused by Shiga toxin-producing Escherichia coli (STEC) O157:H7 by 29% Not on track to reach 2015 target Healthcare-associated Infections (HAIs) empty cell Reduce central line-associated blood stream infections (CLABSI) in hospitals by 60% On track to reach 2015 target Reduce healthcare-associated invasive methicillin-resistant Staphylococcus aureus (MRSA) by 60% On track to reach 2015 target Reduce surgical site infections (SSI) in hospitals by 30% On track to reach 2015 target Reduce catheter-associated urinary tract infections (CAUTI) in hospitals by 30% Not on track to reach 2015 target Motor Vehicle Safety empty cell Reduce fatalities due to motor vehicle crashes by 31% On track to reach 2015 target Teen Pregnancy empty cell Decrease teen birth rates by 20% on track to reach 2015 target HIV empty cell Reduce the number of new HIV infections by 25% Not on track to reach 2015 target Increase the percent of people living with HIV who know their status by 11% On track to reach 2015 target 4 TOBACCO Prevent the initiation of tobacco use, promote quitting, and ensure smoke-free environments Key Strategies  Monitor tobacco use and prevention policies  Protect people from secondhand smoke  Oer help to quit tobacco use  Warn about the dangers of tobacco  Enforce bans on tobacco advertising, promotion and sponsorship  Raise taxes on tobacco Key Highlights 2014  2014 Surgeon General’s Report: The Health Consequences of Smoking – 50 Years of Progress was released in January 2014. The new report concluded that that despite progress, smoking and exposure to tobacco smoke are responsible for more than 480,000 premature deaths annually, as well as at least $289 billion in health care expenses and other economic costs each year.  The evidence-based guide Best Practices for Comprehensive Tobacco Control Programs was updated and released in 2014. The report describes an integrated programmatic structure for implementing interventions proven to be eective and provides levels of state investment to prevent and reduce tobacco use in each state. The report includes expanded information on health equity from the previous versions of Best Practices.  In 2014, CDC launched the third Tips from Former Smokers campaign, focusing on health conditions such as premature birth, periodontal (gum) disease and tooth loss, and HIV complications. The campaign resulted in 80% call volume increase to 1-800-QUIT-NOW and a more than 1,000% increase in average weekly unique visitors to the TIPS website.  Two states and the District of Columbia increased tobacco taxes in 2014, a proven strategy to reduce tobacco use. Additionally, 63 jurisdictions around the country acted to protect the public from secondhand smoke by implementing smoke free ordinances.  CDC sta examined poison control calls related to e-cigarettes for the rst time. The analysis assessed total monthly poison center calls related to e-cigarettes or conventional cigarettes, and found the proportion of e-cigarette calls jumped from 0.3 percent in September 2010 to 41.7 percent in February 2014. More than half of the calls related to e-cigarettes were for children ve years of age or younger.  CDC researchers found that prohibiting smoking in subsidized housing would yield annual cost savings of $496.82 million, including $310.48 million in secondhand smoke-related care, $133.77 million in renovation expenses, and $52.57 million in smoking-attributable re loses. By state, annual overall cost savings ranged from $0.58 million in Wyoming to $124.68 million in New York. See King, B.A., Peck, R.M. and Babb, S.D., National and State Cost Savings Associated with Prohibiting Smoking in Subsidized and Public Housing in the United States, Preventing Chronic Disease, October, 2014. 5 TOBACCO Progress to Date Trends in percentage of adults who smoke cigarettes, 2006–2013 Trends in percentage of youth who smoke cigarettes, 2005–2013 Trends in proportion of U.S. population covered by comprehensive state and/or local laws making workplaces, including restaurants and bars, smoke-free, 2007–2014 6 NUTRITION, PHYSICAL ACTIVITY, & OBESITY Support all Americans in achieving optimal health by making nutritious foods and physical activity easy, attractive, and aordable choices Key Strategies  Promote healthy eating and physical activity in child care centers, schools, hospitals, workplaces, and communities  Promote food service guidelines in cafeterias, concessions, vending, restaurants, grocery stores, and markets  Increase breastfeeding support in early care settings, hospitals, worksites, and communities  Reduce consumption of calories from added sugars  Eliminate articial trans fat in the food supply  Reduce sodium in the food supply Key Highlights 2014  Illustrating the extent of the U.S. obesity burden, the State Adult Obesity Prevalence and Maps were released in September 2014.  Today, 11% of all births in the U.S. occur at Baby-Friendly hospitals, up from less than 2% in 2007. This achievement surpasses the Healthy People 2020 goal of 8.1%. The CDC funded Best Fed Beginnings project contributed to the acceleration of Baby-Friendly designated U.S. hospitals. Nearly one third of all hospitals earning designation as Baby-Friendly in 2014 and early 2015 enrolled in Best Fed Beginnings , a nationwide eort to make quality improvements to maternity care to better support mothers and babies to be able to breastfeed.  Breastfeeding rates continue to rise, according to the 2014 Breastfeeding Report Card . Professional breastfeeding support can help mothers start and continue breastfeeding to meet personal goals and national health recommendations; the Report Card tracks such support. From 2006 through 2013, the number of International Board Certied Lactation Consultants increased from 2.1 to 3.5 per 1,000 live births.  Released in July 2014, The State Indicator Report on Physical Activity presents state-level information on physical activity behaviors and on environmental and policy supports for physical activity.  The Comprehensive School Physical Activity Program (CSPAP) Guide was developed to assist schools and school districts to develop, implement, and evaluate comprehensive physical activity programs. For example, teachers that participated in a CSPAP training in Monroe County, Tennessee changed academic testing days to coincide with mornings that students had before-school physical activities because teachers noticed a positive dierence in student behavior.  Participation in Let’s Move Child Care by early care and education providers increased from 11,981 to 15,963 providers, who serve over 910,000 children. In 2014, learning collaboratives were launched in California (Los Angeles), Kentucky, and Virginia (in addition to 6 states in 2013), and thousands of additional ECE providers across the nation pledged to meet best practices for food, beverages, breastfeeding support, physical activity, and screen time through participation in Let’s Move Child Care.  Through the Sodium Reduction in Communities Program (SRCP), ten grantees across the country are working with partners to increase access to and accessibility of healthier food options, focusing on lower sodium products. Each community is working with a combination of independent restaurants, distributive food programs and/or governmental and non-governmental organizations that sell and serve food. Communities are seeing quantiable success in reducing sodium. For example Philadelphia, a SRCP awardee, is working with multiple partners to reduce sodium content in meals in Chinese take-out Restaurants. As of January 2015, 185 restaurants were enrolled in the initiative. Over 24 months, signicant reductions in sodium content in three main dishes were seen, ranging from 13% to 34%.  As of August 2014, 100% of the U.S. General Services Administration-managed cafeteria’s contracts include the HHS/GSA Health and Sustainability guidelines in the National Capital Regions, moving toward increased adoption of the Food Service Guidelines. 7 NUTRITION, PHYSICAL ACTIVITY, & OBESITY Progress to Date Trends in the prevalence of obesity among U.S. children and adolescents, aged 2–19, 2006–2012 Trends in percentage of infants who are breastfed at 6 months, 2005–2011 8 FOOD SAFETY Keep America’s food supply safe by preventing and responding to foodborne illness Key Strategies  Drive policy and prevention with data and analyses  Investigate outbreaks to stop current and prevent future foodborne outbreaks  Address challenges of culture-independent diagnostic testing with advanced technologies.  Support state and local public health and other partners to fulll their primary roles in addressing food safety priorities.  Improve environmental public health practice to prevent foodborne illness outbreaks at restaurants. Key Highlights 2014  Available for hands-on web access for the rst time, the Atlas of Salmonella in the United States, 1968-2011 summarizes surveillance data on 32 types of Salmonella isolates from people, animals, and other sources. The information is organized by demographic, geographic and other categories. The Atlas enables the reader to compare trends in Salmonella serotypes by following their spread or decline over time and location. This could lead to tailored prevention eorts targeted at specic serotypes.  Since CDC began applying advanced molecular detection (AMD) and enhanced epidemiology methods for nationwide surveillance of Listeria infections, CDC has been able to detect seven clusters of illness that would not have been detected by the older methods. The percentage of Listeria c lusters for which a food source was found increased from 6% in FY 2013 to 21% in FY 2014. One example of a success is a Listeria outbreak that aected at least 32 people in 11 states between October and December 2014. Seven of those people died. Using whole genome sequencing, CDC was able to identify the illnesses as a cluster one week faster than would have occurred with the older methods. CDC worked with state and local health departments, the Food and Drug Administration, and food industries to identify prepackaged caramel apples as the source of the outbreak. Investigation partners were then able to take action to inform the public and get caramel apples o the shelves to keep more people from becoming ill.  The country’s largest grocery retailer is partnering with CDC to decrease pathogens such as Salmonella and Campylobacter in chicken products provided by its suppliers. The new program, announced in December 2014, requires the retailer’s poultry suppliers to implement holistic controls from farm to nal product and is designed to signicantly reduce potential contamination levels, in fresh whole chickens and chicken parts. It also requires suppliers to validate that the measures they have implemented are eective through specialized testing. All poultry suppliers of this grocery retailer must be in compliance with the new requirements by June 2016.  CDC released the 2012 National Antimicrobial Resistant Monitoring System (NARMS) Annual Human Isolates Report to aid in better understanding trends in antibiotic resistance, which helps doctors prescribe eective treatment and helps public health ocials investigate outbreaks faster.  Researchers provided evidence for the importance of kitchen manager certication in restaurant food safety through a CDC-funded study on “Restaurant manager and worker food safety certication and knowledge” (December 2014 Foodborne Pathogens and Disease ). Findings from this study and others indicate certied managers have better food safety knowledge with improvement in food safety practices.  Researchers also identied gaps in restaurant policies and practices concerning ill workers (e.g., lack of policies requiring sick workers to stay home), that if addressed, could help prevent foodborne illness outbreaks, according to a CDC-funded study on “Managerial practices regarding workers working while ill” (January 2015 Journal of Food Protection ). 9  The National Voluntary Environmental Assessment and Information System (NVEAIS) , launched in April 2014, is a national eort to systematically collect, analyze, interpret, and disseminate environmental factor data from foodborne illness outbreak investigations. More than half of all foodborne illness outbreaks are associated with restaurants, banquet halls, and schools and other institutions. The environmental factor data collected through NVEAIS will be used to help determine the causes of outbreaks in these settings, improve outbreak response eorts, and prevent future outbreaks. 8 state and 3 local health departments have registered for NVEAIS since its launch, and 44 outbreaks have been reported by sites in NVEAIS.  CDC’s e-Learning on Environmental Assessment of Foodborne Illness Outbreaks is new, free virtual training that teaches state, local, territorial and tribal environmental health professionals how to collect environmental factor data during foodborne illness outbreak investigations. Over 1,100 people from 48 states and 282 localities across the nation have participated in the e-Learning course since its April 2014 launch. FOOD SAFETY Progress to Date Trends in the rate of infections caused by Salmonella , 2006–2013 Trends in the rate of infections caused by Shiga toxin-producing Escherichia coli (STEC) 0157:H7, 2006–2013 10 HEALTHCAREASSOCIATED INFECTIONS HAI Ensure safe healthcare for all Americans by eliminating healthcare-associated infections Key Strategies  Promote use of National Healthcare Safety Network (NHSN) data to target prevention  Expand collaborations and partnerships to promote and implement proven HAI prevention practices  Develop innovative approaches to prevent HAIs across the healthcare system Key Highlights 2014  National Healthcare Safety Network (NHSN)—the nation’s most widely used HAI tracking system—became the rst fully automated system that electronically captures antibiotic prescriptions and drug susceptibility test results that show which antibiotics work on specic bacteria. This feature is now available to over 15,000 facilities which will contribute to improved physician, pharmacy and laboratory decision making around antibiotic use. CDC continues working to extend the use of the Antimicrobial Use and Resistance (AUR) reporting options nationally.  A new approach to using data for action to protect patients from HAIs, CDC’s Targeted Assessment for Prevention (TAP) strategy allows state agencies, hospitals, and other NHSN users to focus prevention eorts on facilities and units within facilities with excess infections. A pilot of seven Quality Improvement Organizations partnering with CDC to focus catheter-associated urinary tract infections (CAUTI) prevention in low-performing facilities showed early success generating TAP reports and using facility assessment tools.  CDC released updated estimates of the national HAI burden in acute care hospitals following a multistate prevalence survey of HAIs and antibiotic use which estimated the full spectrum of HAIs, identifying where to focus prevention eorts. CDC also released the National and State Healthcare-Associated Infection Progress Report showing how each state and the country as a whole are doing in eliminating six of the most common HAIs. CDC continues to promote these data to inform national, state, and local eorts to protect patients across the healthcare spectrum.  As a part of the eort to promote stewardship to ght antibiotic resistance, CDC issued Vital Signs: Improving Antibiotic Use Among Hospitalized Patients as a call to action and is working with partners to help hospitals establish stewardship programs through practical implementation tools that include Core Elements of Hospital Antibiotic Stewardship Programs and a self-assessment checklist.  CDC continues to promote the role of health departments to assist healthcare facilities in detecting and preventing the spread of HAIs and AR pathogens. In 2014, CDC supported implementation of the regional collaborative approach in 12 states (i.e. Illinois, Vermont, Wisconsin) to control the spread of healthcare-associated multidrug- resistant organisms (MDRO) between healthcare facilities. The Wisconsin/Milwaukee Health Department prevention activity used NHSN to track AR data and focus prevention in all acute care and long term care facilities in the state. 11 Healthcare-Associated Infections (HAI) Progress to Date Trends in central line-associated blood stream infections (CLABSI) in hospitals, 2006–2013 Trends in healthcare-associated invasive methilicillin-resistant Staphylococcus aureus (MRSA) infections, 2007–2013 12 Healthcare-Associated Infections (HAI) Progress to Date Trends in surgical site infections (SSI) in hospitals, 2006–2013 Trends in catheter-associated urinary tract infections (CAUTI) in hospitals, 2006–2013 13 MOTOR VEHICLE SAFETY Keep people safe on the road – everyday Key Strategies  Improve proper restraint use (including seat belts, car seats, and booster seats)  Prevent crashes and injuries among vulnerable populations, including teens, older adults, American Indians and Alaska Natives  Reduce alcohol-impaired driving  Develop and communicate occupational motor vehicle injury prevention and protection information to manufacturers, employers, workers, and others who need it Key Highlights 2014  Released in October 2014, MV PICCS (Prioritizing Interventions and Cost Calculator for States) is an on-line interactive calculator that can help state decision makers prioritize and select motor vehicle injury prevention strategies from a suite of 12 eective interventions that are not in widespread use. MV PICCS calculates the expected number of injuries prevented and lives saved at the state level, as well as the costs of implementation, while taking into account the state’s available resources.  State specic fact sheets on restraint use and drunk driving were created and broadly disseminated. The fact sheets detail the state-level public health burden for both topics and successful strategies for reducing the burden.  Employer and worker information was prepared and broadly disseminated on motor vehicle safety to employers and workers at high risk for motor vehicle crashes. Information included a pamphlet to inform truckers on the importance of quality sleep to prevent drowsy driving, and an article that describes how employers can develop eective motor vehicle safety programs using a consensus-based standard inuenced by CDC science.  Four new standards were developed with partners to enhance safety in ambulance compartments to better withstand crashes and protect emergency medical service workers and patients.  CDC worked to expand work with tribal nations to identify specic risk behaviors associated with motor vehicle fatalities and to focus on opportunities to improve motor vehicle safety, decrease crashes, and reduce motor vehicle related fatalities. Video and online resources were created and updated.  An estimated 2,519,471 Emergency Department visits resulted from nonfatal crash injuries, which resulted in 188,833 hospitalizations and an estimated $18.4 billion in lifetime medical costs and $32.9 billion in lifetime work loss costs, according to CDC Vital Signs on motor vehicle crash injuries released in October 2014. Primary seat belt laws, child passenger restraint laws, ignition interlocks to prevent alcohol impaired driving, sobriety checkpoints, and graduated driver licensing (GDL) systems have demonstrated eectiveness for reducing motor vehicle crashes and injuries. To date, no state has implemented all of these safety measures in accordance with evidence and expert recommendation.  Motor vehicle crash deaths among children age 12 and younger decreased by 43% from 2002-2011; however, still more than 9,000 children died in crashes during that period, according to CDC Vital Signs released on child passenger safety in February 2014. Of children who died in a crash, one in three was not buckled up, and more black and Hispanic children were not buckled compared with white children. CDC recommends that states and communities consider using proven strategies to increase car seat, booster seat, and seat belt use and reduce child motor vehicle deaths.  Sobriety checkpoint programs are eective, according to a systematic review released in conjunction with the Community Guide. However, in looking at the overall use of all sobriety checkpoints (not just those that are publicized or part of a program), 12 states do not allow them at all, and only one-third of the other states use them regularly.  Re-launched in October 2014, Parents Are the Key campaign provides information and tools for parents, pediatricians, and communities that focus on reducing teen driving-related injuries and deaths. Motor vehicle crashes are the leading cause of death among teens. Over 100,000 people have accessed the website and 40,000 materials have been downloaded. 14 MOTOR VEHICLE SAFETY Progress to Date Trends in motor vehicle-related fatalities, 2007–2013 15 TEEN PREGNANCY Reduce teen pregnancy and its contribution to the cycle of poverty for teens and their families Key Strategies  Monitor teen pregnancy/birth rates and prevention policies  Promote the delay of sexual initiation through evidence-based programs and social norm changes  Strengthen clinical services and improve the quality of care  Promote the use of eective contraceptive methods, including long-acting reversible contraception, by sexually active teens Key Highlights 2014  Recommendations for Providing Quality Family Planning (QFP) Services gives all providers of reproductive health services access to national, evidence-based guidance on family planning service delivery, including specic recommendations for serving adolescent clients. The recommendations were released in April 2014.  Working with partners, CDC developed and disseminated provider tools to support widespread understanding and use of the QFP Services, and the Medical Eligibility Criteria and Selected Practice Recommendations for Contraceptive Use. A training course for pediatricians to ensure they have the knowledge, skills and motivation to screen adolescents for sexual activity, and to counsel patients about contraception and other reproductive health matters, was developed and piloted with the America Academy of Pediatricians.  CDC worked to disseminate information and provide learning opportunities to support removing barriers to the use of Long Acting Reversible Contraceptives (LARC) including eorts to clarify the safety and eectiveness of LARC use among adolescent females and Medicaid reimbursement for immediate postpartum insertion of LARC.  CDC, in partnership with the Oce of Adolescent Health (OAH), is providing funding to nine grantees to implement a community-wide initiative to reduce teen pregnancy and births in communities with the highest rates. Grantees have:  Reached over 19,000 youth with evidence-based interventions to prevent teen pregnancy, representing a four-fold increase from 2012. This exceeded the year three goal of 12,500.  Provided contraceptive and reproductive health services to over 50,000 individual adolescents through 63 partner clinics.  Increased LARC coverage by 80% from 2011 among adolescent clients served by health center partners, particularly among African American and White adolescents between 15 and 19 years of age.  In January 2014, CDC initiated a systematic review to examine the body of evidence documenting observed health, economic, and social consequences of teenage pregnancy through systematic review and meta-analytic techniques. CDC met with economic experts and policy leaders (August 2014) to discuss and review the systematic review protocol. The review is expected to be completed in 2016. 16 TEEN PREGNANCY Progress to Date Trends in the rate of births among adolescent females ages 15–19, 2007–2013 17 HIV INFECTION Prevent new HIV infections and ensure quality health care for persons living with HIV Key Strategies  Intensify HIV prevention eorts in communities where HIV is most heavily concentrated  Educate all Americans about the threat of HIV and how to prevent it  Improve data monitoring, dissemination, and feedback  Maximize the proportion of people with HIV who have suppressed viral load by improving diagnosis, linkage and retention in care, and antiretroviral provision and adherence  Expand targeted eorts to prevent HIV infection using a combination of eective, evidence-based approaches for persons living with HIV and those at high risk of infection Key Highlights 2014  Released in 2014, the State HIV Prevention Progress Report (SPR) is the rst annual report highlighting six HIV prevention and care indicators by providing state-level baseline information, baseline national average, and 2015 national goals. The SPR provides an important opportunity to reect on states’ individual progress. It shows that the nation’s HIV goals are achievable, but closing gaps between states will be critical. The next SPR is due to be released in fall 2015.  In April 2014, CDC released new resources to support the Data to Care strategy, which uses surveillance data to identify HIV–diagnosed people who are not engaged in care, to link or re-engage them with care and support the goal of viral suppression among all persons living with HIV. Included is a new Data to Care website which provides technical information to support state and local public health jurisdictions in their use of HIV surveillance data to support continuous, high-quality care for persons living with HIV.  In May 2014, the US Public Health Service and CDC released the rst comprehensive clinical practice guidelines for pre-exposure prophylaxis (PrEP), which is a way for people who do not have HIV but who are at substantial risk of getting it to prevent HIV infection by taking a pill every day.  In June 2014, CDC and the Association of Public Health Laboratories (APHL) issued the Laboratory Testing for the Diagnosis of HIV Infection or HIV Testing Algorithm , which updates recommendations for HIV testing by laboratories in the United States and oers approaches for reporting test results to persons ordering HIV tests and to public health authorities.  In December 2014, CDC, in collaboration with the HIV/AIDS Bureau at the Health Resources and Services Administration (HRSA), the National Institutes of Health (NIH), and ve participating CDC partner organizations (American Academy of HIV Medicine, Association of Nurses in AIDS Care, International Association of Providers of AIDS Care, the National Minority AIDS Council, and Urban Coalition for HIV/AIDS Prevention Services), published Recommendations for HIV Prevention with Adults and Adolescents with HIV in the United States, 2014 which update and expand recommendations from 2003. The updated recommendations address recent advances in biomedical, behavioral and structural interventions and are directed to a broad range of health professionals and organizations focused on optimizing health outcomes for people with HIV and reducing their risk of exposing others to HIV.  Through its Act Against AIDS (AAA) initiative, CDC raises awareness among patients, providers, and the public about HIV. Collectively, AAA eorts have reached millions of people through extensive ad placement, social media engagement, provider information kits and meetings, conferences and trainings. The following campaigns were launched in 2014: 18  HIV Treatment Works is the rst national communication campaign focused exclusively on encouraging treatment and care for people living with HIV (PLWH).  One Conversation at a Time is a national communication campaign that encourages Hispanics/Latinos to talk openly about HIV/AIDS with their families, friends, partners, and communities.   Start Talking. Stop HIV seeks to reduce new HIV infections among gay, bisexual and other men who have sex with men (MSM) by encouraging open discussion about a range of HIV prevention strategies and related sexual health issues between sex partners. HIV INFECTION Progress to Date Trends in the number of new HIV infections, 2006–2010 Trends in the number of people living with HIV who know their status, 2006–2011 19 RESOURCES UPDATE  Winnable Battles Web Site: Updated presentations with national and state data as well as recommended approaches and initiatives. Subscribers to the Winnable Battles web site receive a periodic “ News You Can Use ” eNews Blast that shares innovative practices, tools and strategies to inform public health work.  CDC Vital Signs: Each month, the CDC Vital Signs Program releases a call-to-action about an important public health topic, typically one of the Winnable Battles focus areas. Vital Signs uses the most recent CDC data on health behaviors and outcomes to create materials for key partners and the public and includes scientic papers, infographics, short videos, key messages and more. Vital Signs on Winnable Battles topics can be found at http:// www.cdc.gov/vitalsigns/ or www.cdc.gov/winnablebattles . The resources are free and available for download or print.  Virtual Town Hall Meetings: All public health professionals are invited to a town hall teleconference on the latest CDC Vital Signs report on the second Tuesday of each month at 2–3 pm (ET). Featuring informative subject matter experts and health department ocials, the teleconferences are designed to provide a forum for health ocials to broaden the conversation, build momentum, and carry out evidence-based, eective programs within the public health areas covered by Vital Signs .  Did You Know? (DYK): These quick bullet points are emailed to about 30,000 subscribers weekly to inform public health professionals and move CDC data and recommendations into action. Readers use DYK to educate their constituents; start, change, evaluate, or support programs, policies, and practices; and share with sta, community organizations, boards of health, leaders and decision makers, and others. DYK is also CDC’s most popular syndicated content.  National Health Report: A dedicated web site at www.cdc.gov/healthreport oers a snapshot of our nation’s health, highlighting recent successes and challenges in ghting critical health problems in the United States (U.S.). Up-to-date dashboards, resources, videos and printable fact sheets and infographics are available to assist in Winnable Battles work.  Prevention Status Report: In 2013, CDC released the second set of Prevention Status Reports (PSR) for all 50 states and the District of Columbia, with information on key indicators of public health status, practice, and policy for each Winnable Battle area. Through the PSR, CDC is helping advance evidence-based policy and practice by sharing with health ocials and other policy makers each state’s status on key public health indicators and performance on key policy indicators. Public health leaders can use the PSRs to support public health planning, priority setting, and communications. Although the PSRs include data about public health problems, their primary focus is on policies and practices that can prevent or reduce health risk behaviors and lead to improved health outcomes. Posted at www.cdc.gov/psr , the free reports are available by topic or state. The next PSR is slated for release in 2015.  Sortable Stats: Free and available online, Sortable Stats is an interactive data set comprised of behavioral risk factors and health indicators. The online tool is used as a resource in the promotion of policy, system, and environmental changes. Its data set compiles state-level data for the 50 states, DC, and U.S. territories from various published CDC and federal sources into a format that allows users to view, sort, and analyze data at state, regional, and national levels. Sortable Stats recently expanded to include data on youth marijuana use and cancer deaths. http://wwwn.cdc.gov/sortablestats/ 20  Collaboration with partners: To maximize the impact of the Winnable Battles initiative, CDC works with partners at the national, state, and local levels, including the National Conference of State Legislatures (NCSL), the Association of State and Territorial Health Ocials (ASTHO), and the National Association of County and City Health Ocials (NACCHO). For example:  CDC supports and works with NCSL and ASTHO to bring together state policy makers to learn about Winnable Battles and share evidence-based interventions to address them. CDC also collaborated with NCSL to develop a Winnable Battle “toolkit” for states that outlines each Winnable Battle and includes examples of proven or promising strategies, policy options, and programs that have been eective in addressing Winnable Battles in other jurisdictions.  CDC works with NACCHO in support of Winnable Battles through overall product dissemination, technical assistance, evaluation, and communications.Working with CDC, NACCHO has developed messages and materials that assist local health departments in understanding their role in choosing and promoting Winnable Battles and provides communication and dissemination strategies for Winnable Battles materials and products. NACCHO developed a Winnable Battles web portal on its site, naccho.org,which features progress on a Winnable Battle each month. NACCHO also provides Winnable Battles-related resources, programs, tools, and policy guidelines via short articles in Public Health Dispatch and publicizes Winnable Battles-related news, information, and resources via e-communications and social media outlets, including NACCHO’s blog, NACCHO Voice. For more information about Winnable Battles, visit http://www.cdc.gov/winnablebattles/ . 21 Published April 17, 2015 Winnable Battles 2010-2015 Progress Report