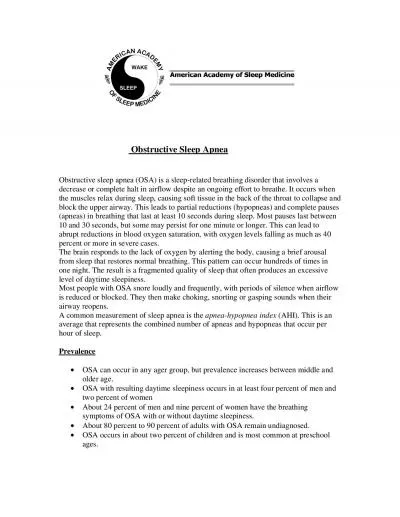
Commissioned by the American Academy of Sleep Medicine Published August 2016 Epidemiology Source Primary research with experts US Census 2014 Peppard Increased Prevalence of Sleepdisordered Breathing in Adults ID: 683408
Download Presentation The PPT/PDF document "Exploring the Economic Benefits of OSA D..." is the property of its rightful owner. Permission is granted to download and print the materials on this web site for personal, non-commercial use only, and to display it on your personal computer provided you do not modify the materials and that you retain all copyright notices contained in the materials. By downloading content from our website, you accept the terms of this agreement.
Slide1
Exploring the Economic Benefits of OSA Diagnosis and Treatment
Commissioned by the American Academy of Sleep Medicine Published August 2016Slide2
Epidemiology
Source: Primary research with experts, U.S. Census (2014), Peppard "Increased Prevalence of Sleep-disordered Breathing in Adults."
American
Journal of Epidemiology (2013
)
© American Academy of Sleep Medicine 2016Slide3
Barriers to Diagnosis & Treatment
Source: Primary and secondary research
© American Academy of Sleep Medicine 2016Slide4
Costs Associated with OSA in United States in 2015
Source: 1
Primary research with experts, secondary clinical research, U.S. Census (2014), Peppard
"Increased Prevalence of
Sleep-disordered
Breathing in Adults." American Journal of Epidemiology (2013), Frost & Sullivan Patient Survey
$162.0 B
Annual
per patient
diagnosis and treatment costs are 67% less than leaving patients undiagnosed.
© American Academy of Sleep Medicine 2016Slide5
Cost Burden of OSA in the Undiagnosed vs. Diagnosis & Treatment Costs
Source: 1Primary research with experts, secondary clinical research, U.S. Census (2014), Peppard "Increased Prevalence of
Sleep-
disordered
Breathing in Adults." American Journal of Epidemiology (2013
), Frost & Sullivan Patient Survey,
Undiagnosed
Diagnosed
# People with OSA
23,500,000
5,900,000
Cost of Undiagnosed OSA ($US
Bil
)
Cost of Diagnosed OSA ($US
Bil
)
Comorbidities
& Mental Health$30.0Diagnosis, Testing and Follow Up$0.8Motor Vehicle Accidents$26.2Non-surgical Treatment$6.2Workplace Accidents$6.5Surgical Treatment$5.4Lost Productivity$86.9Total Costs ($US Bil)$149.6$12.4Cost per Person$6,336$2,105
© American Academy of Sleep Medicine 2016Slide6
Diagnosing and Treating All 29.4M Americans with OSA Could Save $100.1 Billion
TodayWhere 80% of OSA Patients Are UndiagnosedFuture
Where
No
OSA Patients Are Undiagnosed
Healthcare Costs
Non-Healthcare
Costs
Healthcare Costs
Non-Healthcare Costs
Undiagnosed
Diagnosed
Healthcare Costs
Non-Healthcare
Costs
Healthcare Costs
Non-Healthcare Costs
Undiagnosed
Diagnosed$30.0B
$12.4B
$119.6B
$61.9B
$0
$0
$0
$0
Total:
$162.0B
Cost per Person:
$5,511
Total:
$61.9B
Cost per Person:
$2,105
© American Academy of Sleep Medicine 2016Slide7
Sources of Cost for Undiagnosed OSA
Comorbidities & Mental Health
Hypertension
Heart Disease
Diabetes
Asthma/Breathing Disorders
Insomnia
Depression/Anxiety/Mental Health
$5.4 B
$6.4 B
$2.6 B
$2.1 B
$7.1 B
$6.7 B
$30.0 B
Includes cost of healthcare services, medication, and quality of life
.
Motor Vehicle Accidents
Commercial
Non-Commercial
$19.1 B
$7.1 B
$3.5 B
$199M
$15.6 B
$26.2 B
Includes medical
costs, emergency services, property damage, lost productivity, and monetized quality adjusted life years (QALYs) incurred by company,
insurer,
victims, government and others.
Fatal
Non-Fatal
Fatal
Non-Fatal
$6.9 B
Includes fatal and non-fatal accidents. Includes medical costs and lost productivity.
Workplace Accidents
$6.5 B
Lost Productivity
$86.9 B
Productivity
Absenteeism
$83.1 B
$3.8 B
© American Academy of Sleep Medicine 2016Slide8
Three Sources of Cost for Diagnosed/Treated OSA
In-Lab PSG
Diagnosed OSA
$12.4 B
Diagnosis
Non-Surgical Treatment
$817.9 M
$6.2 B
Surgical Treatment
$5.4 B
Home Sleep Testing
UPPP
Maxillomandibular
/ Genioglossus /Hyoid Advancement
Temperature-controlled RF Tongue Base Reduction
Nasal Reconstruction/ Polyp Removal
Pillar Procedure
Sclerotherapy
Tracheotomy for OSA
Bariatric Surgery
Tonsillectomy/ Adenoidectomy
Hypoglossal Nerve Stimulation
$4.1
B
$129 M
$333.3 M
$48 M
$215 M
$4.5 M
$5.5 M
$1.1 M
$4.9 M
$593.8 M
CPAP Titration
Clinic Visits
$212.3 M
$16.7 M
$102.7 M
$486.2 M
PAP/
BiPAP
Machine
PAP Consumables
Oral Appliances
$3.1
B
$3.0 B
$136.8 M
© American Academy of Sleep Medicine 2016Slide9
Comorbidities & Mental Health
Economic Cost
1
:
$30 B
Source:
1
Primary research with experts, secondary clinical research, U.S. Census (2014), Peppard
"Increased Prevalence of Sleep-disordered Breathing in Adults." American Journal of Epidemiology (2013
), Frost & Sullivan Patient Survey
D
iabetes
, stroke, heart disease, and
hypertension have direct costs associated with medical expenses, hospital inpatient visits, medication use and mortality rates.
Mental health can be more subjective including cognitive
function, quality of life, mood, depression, energy levels,
substance abuse and
interpersonal relationships.© American Academy of Sleep Medicine 2016Slide10
Motor Vehicle Accidents
Source: 1Primary research with experts, secondary clinical research, U.S. Census (2014), Peppard "Increased Prevalence of Sleep-disordered Breathing in Adults." American Journal of Epidemiology (2013
),
2
Tefft
, Brian C. "Prevalence of Motor Vehicle Crashes Involving Drowsy Drivers, United States, 2009-2013." AAA Foundation for Traffic Safety. 3
Berger
,
MD
.
“A
Corporate Driven Sleep Apnea Detection and Treatment Program: Results and Challenges."
(2006), Frost & Sullivan Patient Survey
According to AAA
2
, drowsy driving causes nearly 29% or 328,000 crashes each year
109,000 injuries & 6,400 fatalities
Commercial drivers treated on CPAP had a 73% reduction in preventable driving accidents. Annual cost savings for trucking company
3: 1,000 employees: $47.8M 11,000 employees: $8.1B© American Academy of Sleep Medicine 2016Slide11
Workplace Accidents
Source: 1Primary research with experts, secondary clinical research, U.S. Census (2014), Peppard "Increased Prevalence of Sleep-disordered Breathing
in
Adults." American Journal of Epidemiology (2013
), Frost & Sullivan Patient Survey
2 Barnes “"Changing to Daylight Saving Time Cuts Into Sleep and Increases Workplace Injuries.“ (2009)
There was an increase in accident rates on days following
Daylight Saving
Time, “Sleepy Monday”, when just 40 minutes of sleep was lost
2
5.7% spike in workplace injury
67.6% increase in days of work lost due to sustained injuries
Treatment cost savings include reduced lost wages and absenteeism, lower associated medical expenses and better quality of life
Economic
Cost
1
: $6.5B© American Academy of Sleep Medicine 2016Slide12
Lost Productivity
Source: 1Primary research with experts, secondary clinical research, U.S. Census (2014), Peppard
"Increased Prevalence of Sleep-disordered
Breathing
in Adults." American Journal of Epidemiology (2013
), Frost & Sullivan Patient Survey
R
educed
sleep can result
in: Absenteeism, underperformance, behavioral problems, “
cyberloafing
”,
poor decision making, decreased productivity, and the degree of likelihood that an individual will help a
fellow colleague.
Treatment cost savings can result in not only economic productivity, but also improved workplace behavior
Economic Cost
1: $86.9 B© American Academy of Sleep Medicine 2016Slide13
Benefits of Treatment:
The “Triple Aim”Beyond economics and cost savings, imagine what the U.S. would be like if all 29.4 million people with OSA received treatment…
Providers
Aligns with population health incentives
Improved outcomes increases profit in a value-based healthcare system
Lowers healthcare utilization and reduces admissions
Patients
Improves health and life expectancy
Increases productivity
Increases quality of life
Improves relationships
Payors/ Employers
Reduces costs long-term
Increases productivity
Lowers accident rates and liability costs
© American Academy of Sleep Medicine 2016Slide14
What Does the Patient Experience Tell Us that OSA Treatment Can Deliver?
Results of a Recent Survey of 506 Americans Treating their OSA
© American Academy of Sleep Medicine 2016Slide15
Profile of Respondents
Gender
Age Beginning Treatment for Sleep Apnea
Age Diagnosed with Sleep Apnea
Age
Household Income
$61,250
per year
(Mean)
52%
48%
53
years old
(Mean)
53
years old
(Mean)
506 U.S. adults (18+ yrs old) being treated for OSA responded to an online survey
© American Academy of Sleep Medicine 2016Slide16
Profile of Respondents
Geographic Location
Occupational Status
Base: n=506
Q2. What is the state you currently live in?
© American Academy of Sleep Medicine 2016Slide17
Diagnosis and Treatment
What type of healthcare provider initially warned you about the risk of sleep apnea
?
(n=506)
n
=61
What
caused you to raise the issue of your risk of sleep apnea with your healthcare provider?
(n=61)
(Percentages under 3% not shown for transparency).
“I raised the issue”
© American Academy of Sleep Medicine 2016Slide18
Diagnosis and Treatment
What type of doctor diagnosed you with sleep
apnea
?
(n=506)
Time between initial warning about sleep apnea risk and diagnosis following a sleep study (n=506)
(Percentages under 3% not shown for transparency).
© American Academy of Sleep Medicine 2016Slide19
OSA Severity Assessment
Before and after sleep apnea treatment
Base: n=506
Q6a/c. When you were initially diagnosed/ Now that you are being treated, how does your physician describe your sleep apnea?
Q6b/d.When you were initially diagnosed with sleep apnea but before treatment, on average how many hours of sleep did you get in a 24 hour period? How many do you get now that you are being treated?
Average Hours of sleep
(per 24 hrs)
Physician Assessment Upon Diagnosis
5.5 Hrs
(mean)
Physician Assessment During Treatment
7.2 Hrs
(mean)
Average Hours of sleep
(per 24 hrs)
© American Academy of Sleep Medicine 2016Slide20
OSA Treatment
What treatment did you begin upon diagnosis of sleep apnea?
(n=506)
What
treatment(s) are you using today?
(n=506)
In
an average night, for how many hours of sleep do you wear your CPAP/Oral Appliance.
For
how many years have you been using the following treatments
?
Oral Appliance
Oral Appliance
3.7 years
(Mean)
5.6 Hours
(Mean)
CPAP
CPAP
7.4 years
(Mean)
6.3 Hours
(Mean)
© American Academy of Sleep Medicine 2016Slide21
Impact of OSA Treatment on
Sleep Quality © American Academy of Sleep Medicine 2016Slide22
Quality of Sleep - Overall
Before and after sleep apnea treatment On a scale of 1 meaning ‘very bad’ to 5 meaning ‘Very good’, how would you rate the quality of your sleep before and after treatment for sleep apnea? (Percentages under 3% not shown for transparency).
Overall
(n=506)
New User (under 5 years)
(n=188)
Mid-Term User (5 -10 years)
(n=191)
Long-Term User (Over 10 years)
(n=127)
76% reported the
quality of their
sleep as ‘good’/ ‘very good’ after treatment (vs. 7% before treatment). While all user groups indicate improvement, long-term users have the most positive impact after treatment (85%).
© American Academy of Sleep Medicine 2016Slide23
Quality of Sleep Across
ComorbiditiesBefore and after sleep apnea treatment
Depression/ Mental Health
(n=186)
Diabetes
(n=122)
Insomnia
(n=146)
Asthma/ Breathing Problems
(n=129)
Heart Disease
(n=66)
High Blood Pressure
(n=302)
A high proportion of respondents with comorbidities declare their sleep quality as ‘good’/ ‘very good’ after treatment.
T
he biggest difference is among High Blood Pressure patients (79% vs 8% before treatment.) and the smallest among Insomnia patients (65% vs
.
8
% before treatment
.)
© American Academy of Sleep Medicine 2016Slide24
Quality of Sleep – No Comorbidities
Before and after sleep apnea treatment – By years of treatment
Base: n=71
On a scale of 1 meaning ‘very bad’ to 5 meaning ‘Very good’, how would you rate the quality of your sleep before and after treatment for sleep apnea?
No existing medical condition
(n=71)
Respondents with no existing comorbidities are most satisfied with the quality of their sleep after treatment (89% - ‘good/‘very good’ after treatment vs. 7% before) with long term users driving the satisfaction at 94%.
New
User (under 5 years)
(n=23)
Mid-Term User (5 – 10 years)
(n=31)
Long-Term User (Over 10 years)
(n=17)
© American Academy of Sleep Medicine 2016Slide25
Quality of Life and Productivity Benefitsvs.
Willingness to Invest in Treatment© American Academy of Sleep Medicine 2016Slide26
Improving Sleep Quality Improves Quality of Life
© American Academy of Sleep Medicine 2016Slide27
Base: n=354
Hours fully awake, productive and contributing at your
job:
Before Treatment
After Treatment
Days absent from work due to illness
, disability, medical visits or feeling too tired to work
?
Before Treatment
After Treatment
6.9 Hrs
(Mean)
8.1 Hrs
(Mean)
6.3 Days
(Mean)
4.5 Days
(Mean)
+1.2 Hrs of Productivity40% fewer absencesProductivity and AbsenteeismBefore and after sleep apnea treatment © American Academy of Sleep Medicine 2016Slide28
Factors Influencing Amount Patients are Willing to
Pay for Treatment
Perceived Benefit of Treatment
Total Household Income
Employment
of Patient
Amount Willing to Pay for Treatment
The diagram was derived using statistical linear regressions.
High Influence
Moderate Influence
Low Influence
© American Academy of Sleep Medicine 2016Slide29
Q15. What is the maximum
amount you would be willing to pay out of your own pocket each month to treat your sleep apnea?
Mean: $51 per month or $612 per year
37% are not willing to pay
When
you consider how much money you have spent treating your sleep apnea, do you feel like that investment was worth the benefits you received?
Base: (n=506)
Base excludes those who responded “Don’t know” (13% of sample)
Investment and Benefit
© American Academy of Sleep Medicine 2016Slide30
Impact of Treatment on Patients with
Comorbidities© American Academy of Sleep Medicine 2016Slide31
Existing Medical Conditions
Medical
Condition
% of respondents
Hypertension
(n=288)
Diabetes
(n=111)
Asthma
and Other Breathing Problems (COPD, Emphysema, etc
.)
(n=122)
Insomnia
(n=134) Depression, Anxiety or Other Mental Health Problems (n=176) Heart Disease (n=54)
None
of the
above
(n=70)
© American Academy of Sleep Medicine 2016Slide32
Sleep Quality in Patients with
HypertensionBefore and after sleep apnea treatment
Base: n=302
On a scale of 1 meaning ‘very bad’ to 5 meaning ‘Very good’, how would you rate the quality of your sleep before and after treatment for
sleep apnea?
Sleep Quality
(n=302)
New User (under 5 years)
(n=114)
Mid-Term User (5 – 10 years)
(n=109)
Long-Term User (Over 10 years)
(n=79)
© American Academy of Sleep Medicine 2016Slide33
Hypertension Severity
Before and after sleep apnea treatment
Hospital visits for Hypertension
Hypertension seriousness before and after treatment of OSA
Base: n=288 (Percentages under 3% are not shown for transparency).
Before
Since Treatment
Mean: 1.5 Times
Mean: 0.8 Times
© American Academy of Sleep Medicine 2016Slide34
Blood Pressure Improvement and Medication Usage
Before and after sleep apnea treatment
Change in Blood Pressure Medication following 1 year of OSA treatment
Change in Blood Pressure following OSA treatment
Slightly Decreased (1%-49% lower dose)
Significantly Decreased (50%+ lower dose)
Significantly Increased (50%+ higher dose)
Significantly improved
Slightly improved
19%
22%
1%
8%
9%
Began medication after treatment started
Have never taken medication
No Change
Stopped taking medication after change
Do not remember
48%
No Change
Base: n=288
© American Academy of Sleep Medicine 2016Slide35
Sleep Quality in Patients with Heart Disease
Before and after sleep apnea treatment – By years of treatment
Base: n=66
On a scale of 1 meaning ‘very bad’ to 5 meaning ‘Very good’, how would you rate the quality of your sleep before and after treatment for sleep apnea?
Sleep Quality
(n=66)
New User (under 5 years)
(n=22)
Mid-Term User (5 – 10 years)
(n=25)
Long-Term User (over 10 years)
(n=19)
© American Academy of Sleep Medicine 2016Slide36
Heart Disease Severity
Before and after sleep apnea treatment
Heart Disease seriousness
b
efore and after OSA treatment
Base: n=54 (Percentages under 3% are not shown for transparency).
Heart disease
r
elated
h
ospital
v
isits
Before
Since Treatment
Mean: 2.4 Times
Mean: 2.2 Times
© American Academy of Sleep Medicine 2016Slide37
Heart Disease Improvement and Medication UsageBefore
and after sleep apnea treatment Base: n=54
Change in Heart Disease Following OSA Treatment
Change in Heart Disease Medication Usage After 1 year of OSA Treatment
Decreased (1%-49% lower dose)
Decreased (50%+ lower dose)
Increased (50%+ higher dose)
Increased (1%-49% higher dose)
4
%
6
%
6
%
9
%
Slightly worsened
Significantly worsened
Significantly improved
Slightly improved
30%
26%
4
%
2
%
No Change
37%
Began medication after treatment started
Have never taken medication
No Change
Stopped taking medication after change
Do not remember
© American Academy of Sleep Medicine 2016Slide38
Quality of Sleep in Patients with Diabetes
Before and after sleep apnea treatment – By years of treatment
Base: n=122
On a scale of 1 meaning ‘very bad’ to 5 meaning ‘Very good’, how would you rate the quality of your sleep before and after treatment for sleep apnea?
Sleep Quality
(n=122)
New User (under 5 years)
(n=41)
Mid-Term User (5 – 10 years)
(n=50)
Long-Term User (over 10 years)
(n=31)
© American Academy of Sleep Medicine 2016Slide39
Diabetes Severity
Before and after sleep apnea treatment
Diabetes seriousness before and after OSA treatment
Base: n=111 (Percentages under 3% are not shown for transparency).
Diabetes related hospital visits before and 1 year after OSA treatment
Before
Since Treatment
Mean: 2.8 Times
Mean: 1.5 Times
© American Academy of Sleep Medicine 2016Slide40
Diabetes Improvement and Medication Usage
Before and after sleep apnea treatment Base: n=111
Change in
hemoglobin
A1C test score following OSA treatment
Slightly worsened
Significantly worsened
Significantly improved
Slightly improved
8%
23%
3%
0%
Change in diabetes medication usage 1 year after OSA treatment
Decreased (1%-49% lower dose)
Decreased (50%+ lower dose)
Increased (50%+ higher dose)
Increased (1%-49% higher dose)
8
%
13%
5
%
3%
No Change
42%
Began medication after treatment started
Have never taken medication
No Change
Stopped taking medication after change
Do not remember
© American Academy of Sleep Medicine 2016Slide41
Quality of Sleep in Patients with Asthma/Breathing
ProblemsBefore and after sleep apnea treatment – By years of treatment
Sleep
Qualilty
(n=129)
Base: n=129
On a scale of 1 meaning ‘very bad’ to 5 meaning ‘Very good’, how would you rate the quality of your sleep before and after treatment for
sleep apnea?
New User (under 5 years)
(n=44)
Mid-Term User (5 – 10 years)
(n=49)
Long-Term User (over 10 years)
(n=36)
© American Academy of Sleep Medicine 2016Slide42
Asthma/Breathing Problems Severity
Before and after sleep apnea treatment
Asthma
or
other Breathing Problems seriousness before and after OSA treatment
Base: n=122 (Percentages under 3% are not shown for transparency).
Asthma
or Other Breathing Problems
related hospital visits before and 1 year after OSA treatment
Before
Since Treatment
Mean: 2.2 Times
Mean: 1.9 Times
© American Academy of Sleep Medicine 2016Slide43
Change in medication usage for asthma
or other breathing p
roblems after 1 year of OSA treatment
Base: n=122
Change in breathing function following OSA treatment
Decreased (1%-49% lower dose)
Decreased (50%+ lower dose)
Increased (50%+ higher dose)
Increased (1%-49% higher dose)
2%
6
%
7%
9
%
Slightly worsened
Significantly worsened
Significantly improved
Slightly improved
24%
30%
4
%
2
%
No Change
38%
Asthma/Breathing Problems Improvement and Medication Usage
Before and after sleep apnea treatment
Began medication after treatment started
Have never taken medication
No Change
Stopped taking medication after change
Do not remember
© American Academy of Sleep Medicine 2016Slide44
Quality of Sleep in Patients with Insomnia
Before and after sleep apnea treatment – By Years of TreatmentBase: n=146
On a scale of 1 meaning ‘very bad’ to 5 meaning ‘Very good’, how would you rate the quality of your sleep before and after treatment for
sleep apnea?
Sleep Quality
(n=146)
New User (under 5 years)
(n=65)
Mid-Term User (5 – 10 years)
(n=47)
Long-Term User (over 10 years)
(n=34)
© American Academy of Sleep Medicine 2016Slide45
Insomnia seriousness before and after OSA treatment
Base: n=134 (Percentages under 3% are not shown for transparency).
Healthcare provider visits before and after OSA treatment
Before
Since Treatment
Mean: 4.3 Times
Mean: 3.3 Times
Insomnia Severity
Before and after sleep apnea treatment
© American Academy of Sleep Medicine 2016Slide46
Change in insomnia medication usage 1 year following OSA treatment
Insomnia Improvement and Medication Usage
Before and after sleep apnea treatment
Base: n=134
Change in insomnia symptoms and frequency following OSA treatment
Decreased (1%-49% lower dose)
Decreased (50%+ lower dose
)
Increased (50%+ higher dose)
Increased (1%-49% higher dose)
0
%
7%
6
%
6%
Slightly worsened
Significantly worsened
Significantly improved
Slightly improved
45%
28%
1%
0%
No Change
22%
Began medication after treatment started
Have never taken medication
No Change
Stopped taking medication after change
Do not remember
© American Academy of Sleep Medicine 2016Slide47
Quality of Sleep in Patients with Depression/Mental
Health ProblemsBefore and after sleep apnea treatment – By years of treatment
Sleep Quality
(n=186)
Base: n=186
On a scale of 1 meaning ‘very bad’ to 5 meaning ‘Very good’, how would you rate the quality of your sleep before and after treatment for sleep apnea?
New User (under 5 years)
(n=78)
Mid-Term User (5- 10 years)
(n=58)
Long-Term User (over 10 years)
(n=50)
© American Academy of Sleep Medicine 2016Slide48
Depression, Anxiety or Other Mental Health Problems Severity
Before and after sleep apnea treatment
Depression, Anxiety or Other Mental Health problems seriousness before and after OSA treatment
Base: n=176 (Percentages under 3% are not shown for transparency).
Depression
,
Anxiety/Mental
Health
problems healthcare providers visits before and 1 year after OSA treatment
Before
Since Treatment
Mean: 18.2 Times
Mean: 14.8 Times
© American Academy of Sleep Medicine 2016Slide49
Base: n=176
Days without feelings of depression,
anxiety/ mental
health problems
before and after treatment of OSA
Change in Depression, Anxiety/ Mental Health
problems medication usage after 1 year of OSA treatment
Decreased (1%-49% lower dose)
Decreased (50%+ lower dose)
Increased (50%+ higher dose)
Increased (1%-49% higher dose)
6
%
10%
9%
7
%
Slightly worsened
Significantly worsened
Significantly improved
Slightly improved
23%
26%
1%
2
%
No Change
38%
Depression, Anxiety or Other Mental Health
Problems Improvement and Medication Usage
Before and after sleep apnea treatment
Began medication after treatment started
Have never taken medication
No Change
Stopped taking medication after change
Do not remember
© American Academy of Sleep Medicine 2016Slide50
Mental Health Attributes
Before and after sleep apnea treatment
Quality of Life
Relationship with Bed Partner
Degree of Patience
Quality of Mood
Base: n=506
On a scale of 1 meaning ‘very bad’ to 5 meaning ‘Very good’, how would you rate <attribute> before your treatment for sleep apnea and today?
(Percentages under 3% not shown for transparency).
Top 2 Box
(‘Good’ and Very ‘Good
’)
© American Academy of Sleep Medicine 2016Slide51
Substance Abuse and Weight
Before and after sleep apnea treatment
Sleeping Pills
Sleeping Pills
Alcoholic Drinks
Alcoholic
Drinks
Cigarettes
Cigarettes
Vs
2.9
22.3
1.4
2
8.5
1.1
Then
(Per week)
Now
(Per week)
Mean Score
Mean Score
Mean Score
Mean Score
Mean Score
Mean Score
Q68. Weight Gain/ Loss
(since beginning of treatment)
Q62-Q67. Before treatment how many cigarettes/ alcoholic drinks/ sleeping pills did you smoke/ drink/ take on average per week?
And how many since treatment?
Lost
Gained
© American Academy of Sleep Medicine 2016Slide52
Summary of Findings
© American Academy of Sleep Medicine 2016Slide53
OSA Treatment Economic Analysis
Annual per patient diagnosis and treatment costs are 67% less than leaving patients undiagnosedDiagnosing and treating all
29.4M Americans with OSA
could save
$100.1 billion
Biggest opportunity cost involves lost workplace productivity
© American Academy of Sleep Medicine 2016Slide54
Diagnosis and Treatment of OSA – The Patient Perspective
Physician specialists most common provider warning about OSA riskOnly 30-40% began discussions
about OSA with PCP
70% received OSA diagnosis <2 months
after initial risk identification
PAP therapy
most common treatment
Over time,
PAP use may drop
in favor of weight loss and sleep positioning
However, weight loss
not emphasized
© American Academy of Sleep Medicine 2016Slide55
OSA Treatment Benefits – The Patient Perspective
Respondents gained an additional 1.7 hours of sleep after treatment
11x increase reporting sleep as “good” or “very good”
following treatment with a long-term persistence effect beyond initial adoption
The percentage of respondents stating their
quality of life was “good/very good” tripled (26% vs. 76%) following treatmentSatisfaction with bed partner relationship, mood and patience doubled
Use of alcohol, cigarettes, and sleeping aids
substantially declined
post-treatment
Productive work time grew 17%
after treatment
Work absences declined 40%
after treatment
© American Academy of Sleep Medicine 2016Slide56
Treating OSA Saves Patients Money
Home
Decrease in
direct medical costs and co-pays:
3% of OSA patients with hypertension able to stop and another 17% decrease medication
Diabetics with treated OSA report nearly half (2.8 vs. 1.5) the annual hospital visits Reducing use of depressives and stimulants to manage symptoms:
31% fewer alcoholic drinks = $187.20 savings per year ($4 per drink)
62% fewer cigarettes = $197.70 savings per year ($0.28 per cigarette)
21% fewer sleeping pills = $31.20 savings per year ($2 per pill)
Reducing cost of
auto accidents and higher insurance premiums
Source: 2015 Frost &
Sullian
survey of 506 treated OSA patients in United States.
Bureau of Labor Statistics.
Workplace
1.8
days fewer workplace absences per year
= $363.46 new earnings per year for hourly workers 1.2 hours of increased productivity per day = Equivalent to $4,274.25 more value per employee and contributing to promotions, bonuses, and greater job stability for patients© American Academy of Sleep Medicine 2016Slide57
Out-of-Pocket Patient Spending on OSA
78% said OSA treatment a good investment relative to what they spent out-of-pocket Respondents willing to spend a
an average of $612 per year
on OSA treatment
~
1/3 unwilling to spend ANYTHING for OSA treatment despite benefits
© American Academy of Sleep Medicine 2016Slide58
OSA Treatment Has a Major Impact on Comorbidities
After one
year, p
atients surveyed state
OSA
treatment delivers…
Hypertension
41% report blood
pressure improvement
17% report decrease in medication usage
Diabetes
31% report improved HbA1c
14x increase in “good quality” sleep
Asthma & Breathing Conditions
54% report improved respiratory function
70% increase
in patients reporting symptoms as mild
8x increase in “good quality” sleep© American Academy of Sleep Medicine 2016Slide59
OSA Treatment Has a Major Impact on Comorbidities
Z
Z
Z
After one
year, p
atients surveyed state
OSA
treatment delivers…
Insomnia
7x
increase in good quality sleep
Decline from 54% to 1% reporting “very bad” quality sleep
Depression, Anxiety and Mental
Health
12x increase in “good quality” sleep
4x reduction in reported life threatening
mental health condition49% report improved mental healthHeart Disease56% report reduced heart disease risk5x decrease in self-reported life-threatening heart disease Decline from 50% to 3% reporting “very bad” quality sleep Increase from 0% to 26% reporting “very good” quality sleep© American Academy of Sleep Medicine 2016