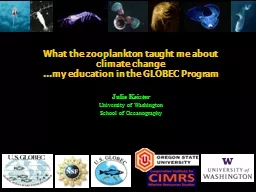
School of Oceanography What the zooplankton taught me about climate change my education in the GLOBEC Program US GLOBEC Northeast Pacific Program To provide climatology background and variability ID: 759261
Download Presentation The PPT/PDF document "Julie Keister University of Washington" is the property of its rightful owner. Permission is granted to download and print the materials on this web site for personal, non-commercial use only, and to display it on your personal computer provided you do not modify the materials and that you retain all copyright notices contained in the materials. By downloading content from our website, you accept the terms of this agreement.
Slide1
Julie Keister
University of WashingtonSchool of Oceanography
What the zooplankton taught me about climate change…my education in the GLOBEC Program
Slide2U.S. GLOBECNortheast Pacific Program
To
provide
climatology background and variability
Long-Term
Observation Program
Mesoscale Process
Studies
Core NEP Hypothesis:
Spatial and temporal variability in mesoscale circulation is the dominant forcing on zooplankton distribution, biomass, production, retention and loss from coastal areas.
Ocean color
Large scale climate variability
Mesoscale physical variability
Zooplankton variability
Ecosystem change
Slide3U.S. GLOBEC
Northeast Pacific Program
Newport
Cape Blanco
Crescent City
Eureka
Pt. Arena
Mesoscale Process Study Region
Surface Temperature
Slide4Cruises: June and August 2000 / 2002 3 vessels per cruise (Survey, Process, Fish)
NEP Mesoscale Process Studies
Survey vessel:
SeaSoar Bio-acoustics ADCP Optical Plankton Counter AC-9 (optics)
Process vessel:
Zooplankton nets
CTD casts
Rate measurements Mammal and seabird observations
Fishing vessel:
Nekton
Salmon prey fields
CTD casts
Slide5°C
1 August 2000
GLOBEC August 2000 CCS Mesoscale cruise
Satellite SST :
RV New Horizon
Slide66
Sea surface temperature from the AVHRR
ADCP figure from
Barth et al. 2005
August 2000 Mesoscale cruise:
ADCP profile:
East component
(cm/s)
(blue = west)
17m
200m
17m
200m
North component
(cm/s)
(pink=north)
-20 cm/s
20-30 cm/s
Slide7August 2000Strong physical control of biological patterns
42N
43N
44N
Copepod
Biomass
Ocean
color
125W
127W
127W
Sea Surface
Temperature
125W
125W
127W
Calanus marshallae
(cold-water, boreal species)
Calanus pacificus
(
warm-water species
)
125W
127W
125W
127W
Keister, Peterson, and Pierce, 2009
Slide8Sea surface temperature from the AVHRR
Population and biomass loss from coastal regions:
0-100 m velocities from ADCP
>1200
tons C / day
>900
tons C / day
Loss of
~2% / day
of total coastal biomass
Keister, Peterson, and Pierce, 2009
Slide948
464442403836
Sea level anomaly (cm)
Latitude (°N)
25
20
151050-5-10-15-20-25
1993199519971999200120032005
48
464442403836
Energy (cm2)in 4-12 week periods
25
20 15 10 5 0
1993
1995
1997
1999200120032005
Spatial and temporal variability in mesoscale circulationJ Keister and PT Strub, J Geophys. Res., 2008
Slide10Index of Mesoscale (4-12 week period) Energy
Keister and Strub, 2008
1993
1994
1995
1996
1997
1998
1999
2000
2001
2002
2003
2004
2005
4-12 week variability in SSH
averaged over 36° to 43°N, 1° to 3° offshore
Normalized
power
0
1
Mechanisms remained unclear……
Slide11Large scale climate variability
Mesoscale physical variability and transport dynamics
Zooplankton variability
Ecosystem change
Dominance of the mesoscale?
Slide12126
124
122
36
38
40
42
44
46
48
Long-Term Observation Program
Newport Hydrographic (NH) Line
U.S. GLOBEC
Northeast Pacific Program
Newport
Cape Blanco
Crescent City
Eureka
Pt. Arena
NH5 zooplankton time series
NH10 mooring
Slide13El Niño distributional shifts:
Nyctiphanes
simplex
Coastal, cold-water
taxon
Sagitta
pseudoserratodentata
Sagitta
hexaptera
Centropages
bradyi
Offshore taxa
Keister et al. 2005
Slide14El Niño distributional shifts:
Keister et al. 2005
0
0.5
1
Nyctiphanes
simplex
abundance at NH-5
Jan 97
Jan 98
Jan 99
Jan 00
Jan 01
Jan 96
12 Dec ‘97
12 Nov ‘98
Kosro
2002:
Anomalous poleward velocities at NH10=
13.7 cm/s (350 km/month)
Estimated 3.3 months to arrive off Oregon
Actual arrival – 3 weeks later
Slide151
2
Jul-96
Jan-97
Jul-97
Jan-98
Jul-98
Jan-99
Jul-99
Jan-00
Jul-00
Jan-01
Jul-01
Jan-02
Jul-02
Jan-03
Jul-03
Jan-04
Jul-04
Jan-05
Jul-05
Jan-06
Jul-06
Jan-07
Quantifying zooplankton community variability
Community cluster time series
Axis 1 (71%)
Axis 2 (13%)
Non-Metric Multidimensional ordination
Warm-water/oceanic
community
Cold-water/coastal
community
-
2
-
1.5
-
1
-
0.5
0
0.5
1
1.5
2
2
1
Slide16-2
-1
0
1
2
CCI score
1998
2000
2002
2004
2006
2008
1996
PC1 of copepods
CCI Timeseries
-2
-1
0
1
2
CCI score
Warm
Cold
Warm
Cold
Monthly anomalies
1998
2000
2002
2004
2006
2008
1996
“Copepod Community Index” = CCI
Ordination Axis 1 scores
PDO:CCI correlation R
= 0.5, p<0.01
Slide17Calanus
marshallae
Pseudocalanus
mimus
Acartia
longiremis
Paracalanus parvus
Oithonasimilis
3mm
Not all copepods are created equal!
Boreal species =
larger and lipid filled
Calanus
Warm years
Cold years
Copepod Community relates to salmon survival:
Slide18170
160
150
140
130
120
110
2
5
3
0
3
5
4
0
4
5
5
0
5
5
6
0
6
5
170
160
150
140
130
120
110
2
5
3
0
3
5
4
0
4
5
5
0
5
5
6
0
6
5
PDO - Cold Phase
PDO - Warm Phase
Climate-Forcing
Hypothesis
:
Basin-scale circulation links the PDO to local ecosystem change.
Strub, modification of
Chelton
and Davis
,
1982
Slide19Basin-scale control of ecosystems?
E. Di Lorenzo
J. KeisterA. ThomasPT StrubWT PetersonS. BogradP. FranksF. SchwingK. ChaakA. Bracco
International collaborators: Japanese: (Chiba, Sasai, Sagaki, Tagushi, Ishidi, Nonaha), Chilean: (Escribano, Hormazabal, Pizarro, Rutllait, Montecino); Canadian (Mackas, Foreman, Pena, Crawford) collaborators on physics and biological variability
Slide20Transport pathways explain an important
part of copepod community structure:
Slide21The test?Compare modeled transport to zoop. observations
Nested ROMS model http://www.myroms.org/)10 km resolution30 vertical layersboundary conditions from World Ocean Atlas climatologynudged at open boundariesforced by NCEP winds and SST1950-2008Passive tracers released continuously along the 4 regional domain boundaries (NORTH, SOUTH, EAST, WEST) with 12-month decay scales.Time series integrated over 1x2 degree region centered on zooplankton observations.
Slide22FromEAST
FromSOUTH
FromNORTH
FromWEST
1955
1965
1975
1985
1995
2005
-2
-1
0
1
2
3
-3
-2
-1
0
1
2
-1
0
1
2
3
4
-1
0
1
2
3
Model hindcast CCI =
NORTH tracer
+
SOUTH tracer
+
EAST tracer
+
WEST tracer
+
ε
Passive Tracer Time Series
Keister et al. 2011
Slide231998
2000
2002
2004
2006
2008
R = 0.36
Model hindcast CCI
Observed
CCI
(5 year
l
owpass
)
R = 0.95
Model hindcast CCI
Observed CCI
1998
2000
2002
2004
2006
2008
(5 year
l
owpass
)
1960
1970
1980
1990
2000
R = 0.9
Model hindcast CCI
Model PDO
Keister et al. 2011
Advective control of zooplankton communities?
Slide24How do large-scale climate modes drive coherent ecosystem changes around ocean basins?
Slide251960-1975
1981-1999
Low-Frequency Zooplankton and Transport Dynamics in the KOE
S.
Chiba
(JAMSTEC, Japan) A. Davis (GaTech, USA)J. Keister (UW, USA) H. Song (UCSD)B. Taguchi (JAMSTEC)E. Di Lorenzo (GaTech)
OFES Model
10 km resolution 1950-2009
Change in distributions of warm and cold-water copepods pre- and post- regime shift
Chiba et al. 2010
Abundance
Slide26Slide27What I we learned
A LOT !!
Large scale climate modes
Mesoscale transport dynamics
Basin-scale transport dynamics
Zooplankton variability
Ecosystem change
Slide28Looking ahead:
Interdisciplinary science is necessary to understand complex systems and problems
Time series observations are gold
“You can learn a lot by looking”
Need big thinkers, synthesis ideas
Trend toward larger collaborative, or smaller, individual, projects?
Looking forward to future collaborations !
Slide29Emanuel Di Lorenzo
GA Tech U
ROMS Modeler
Rodger
Harvey,
Se-Jong
Ju
University of MarylandEuphausiid aging
Steve Bograd, Frank SchwingNOAA SWFSC
Jane Huyer, Bob Smith, Pat Wheeler, Ev and Barry Sherr, Mike Kosro NEP GLOBEC LTOP
Patrick
Ressler
NOAA AFSC
Bioacoustics
Tim Cowles, Hal
Batchelder, Ted Strub, Bill PetersonPh D Committee
Ric
Brodeur, Kym Jacobson, Bob Emmett, Bill Peterson, Tom Wainwright, Peter Lawson, Ed CasillasNOAA NWFSC, Salmon biology
Collaborations developed, friends made
Cynthia
Suchman
NPRB
Dave
Mackas
Fish and Oceans Canada
Zooplankton ecology
The Peterson Lab!
Zooplankton ecology
Jaime Gomez
CICIMAR, MexicoEuphausiid ecology
Sanae
Chiba,
Hiro SugisakiJAMSTEC, Japan
Andy Thomas, Jack
Barth,
Steve
Pierce,
Ricardo
Letelier
, Yvette
Spitz, Mike
Kosro
,
Meng
Zhou
GLOBEC Mesoscale Studies