PPT-MATH 110 Sec 14.1 Statistics-Organizing & Visualizing D
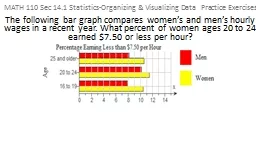
The following bar graph compares womens and mens hourly wages in a recent year What percent of women ages 20 to 24 earned 750 or less per hour MATH 110 Sec 141 StatisticsOrganizing
Download Presentation
"MATH 110 Sec 14.1 Statistics-Organizing & Visualizing D" is the property of its rightful owner. Permission is granted to download and print materials on this website for personal, non-commercial use only, provided you retain all copyright notices. By downloading content from our website, you accept the terms of this agreement. Download
Presentation Transcript
Transcript not available.