PDF-Poisson clumping Samples Which of the following grids
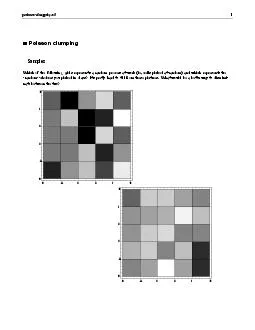
What would be a better way to discrimi nate between the two poissonclumpingnb brPage 2br Generating grids from choices Start off by picking the size of the array
Download Presentation
"Poisson clumping Samples Which of the following grids" is the property of its rightful owner. Permission is granted to download and print materials on this website for personal, non-commercial use only, provided you retain all copyright notices. By downloading content from our website, you accept the terms of this agreement.
Presentation Transcript
Transcript not available.