/
Surpluses in the hydrological cycle Surpluses in the hydrological cycle

Surpluses in the hydrological cycle - PowerPoint Presentation

briana-ranney
briana-ranney . @briana-ranney
Follow
386 views
Uploaded On 2019-11-22

Surpluses in the hydrological cycle - PPT Presentation

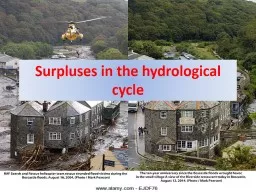
Surpluses in the hydrological cycle Today we are learning this content 55 a and b Prepare for learning Complete the key terms Flooding the occurs when intense rainfall has insufficient time to infiltrate the soil so flows overland ID: 766982

flooding flood impacts floods flood flooding floods impacts term water environmental economic short 2010 damage aquatic long social lead

Share:

Link:

Embed:

Download Presentation from below link

Download Presentation The PPT/PDF document "Surpluses in the hydrological cycle" is the property of its rightful owner. Permission is granted to download and print the materials on this web site for personal, non-commercial use only, and to display it on your personal computer provided you do not modify the materials and that you retain all copyright notices contained in the materials. By downloading content from our website, you accept the terms of this agreement.


Presentation Transcript

Surpluses in the hydrological cycle

Today we are learning this content: 5.5 (a and b)

Prepare for learning Complete the key terms Flooding the occurs when intense rainfall has insufficient time to infiltrate the soil, so flows overland Flooding that occurs after the ground has become saturated from prolonged heavy rainfall A flood with an exceptionally short lag time - often minutes or hours A type of glacial outburst flood that occurs when the dam containing a glacial lake fails. Groundwater flooding Flash flooding Jokulhlaup Surface water flooding

A number of environments are more at risk Low-lying parts of flood plains and river estuariesUrbanised areasSmall basins For each of these environments explain why they may be more at risk of flooding – use Hodder p30

What causes flooding? Present new information What meteorological factors cause flooding ? Physical factors! Page 31 and top of p32 Hodder. Use the fig 2.12 too

E xaminers key points Its crucial to have case studies for each one

Flooding - examples Present new information Monsoon rain – Pakistan http:// www.bbc.co.uk/news/world-asia-india-29171823 Prolonged rainfall - The UK Snow melt- Bangladesh For each of these examples, you need to read through the geo factsheet and highlight the key points. You need to formulate notes in your book which helps you to explain why the floods occurred in these places. Be sure where applicable that you make sense of the synoptic chart that is shown. Recap on how monsoons happen: http ://climate.ncsu.edu/edu/k12/. monsoons The Effects: https:// www.britannica.com/science/West-African-monsoon Flash Floods: http://www.bbc.co.uk/news/av/world-europe-29529414 / french -flash-floods-wreak-havoc-in-southern-city-of- montpellier Snow Melt: https :// water.usgs.gov/edu/watercyclesnowmelt.html

Human causes of flooding Human causes of flooding Climate change River management Change of land use Urbanisation Deforestation

How can we understand flood risk? Flood frequencyThe size of the largest flood event for each year for a particular location is placed in rank order, with Rank 1 being the largest for all available records for any given location. The following calculation is applied to calculate the time interval between floods of a similar size.   T = n+1 M Where T = recurrence interval N = number of years of observation M = rank order  The calculated recurrence level indicates the number of years within which a flood of this size might be expected.Limitations: based on historic data which means similar floods may occur more/less frequently. Climate change would lead us to think events will be more frequent.The floods of highest magnitude will have much longer return periods – While they have the highest impact they may be less likely to occur. Flood return Also known as the flood recurrence interval Estimate of the likelihood of a flood of a certain size recurring. A flood likely to happen once in ten years has a 10% chance of happening in any one year However…. This cannot be used as a forecast as a flood may happen more than once in the same time interval or may not occur at all.

Between 1900 and 2010 the Emergency Events Database (EM-DAT) recorded over 3000 flood disasters worldwide. Intense flooding can lead to over supplies of sediment and nutrients, with possible eutrophication and destruction of aquatic plants. 90% of all flood deaths and 50% of economic damage occurs in Asia (China, India, Bangladesh, Pakistan and Vietnam) Floods can recharge groundwater systems, fill wetlands, increase connectivity between aquatic habitats, and move sediment and nutrients around the landscape . Flood depth is linked to mortality. In many LICs many people have not learnt to swim . Worldwide children and old people are particularly vulnerable.Intense flooding can lead to pollution from nitrates, chemicals and heavy metals, all of which degrade aquatic habitats.In HDCs property values are severely impacted in flood prone areas. Issues also arise when coming to resell properties Structural damage to properties in all countries in a major cause of tangible flood lossesCrops, livestock and agricultural infrastructure suffer major damage. Subsistence farmers lose a lot of food supply. In HDCs this can also cause escalating food pricesDestruction of bridges e.g. Cockermouth, Cumbria can make communication between parts of settlements difficult.In NICs growth exceeds flood defence provision so infrastructural loses are highIncome from tourism is disrupted. The degree of threat posed by a flood depends on the depth and velocity of the water. Water 0.5m deep can wash cars away and cause the foundations of buildings to collapseFlooding can trigger breeding of species and encourage migration and dispersal. Floods between 1900 and 2010 were responsible for 200,000 deaths and 3 billion being impacted in some way In LDCs post-flood morbidity is likely due to water borne diseases and secondary flood hazards. Colour code your version of the grid above to show whether the impacts are socio economic or environmental

Between 1900 and 2010 the Emergency Events Database (EM-DAT) recorded over 3000 flood disasters worldwide. Floods between 1900 and 2010 were responsible for 200,000 deaths and 3 billion being impacted in some way 90% of all flood deaths and 50% of economic damage occurs in Asia (China, India, Bangladesh, Pakistan and Vietnam) The degree of threat posed by a flood depends on the depth and velocity of the water. Water 0.5m deep can wash cars away and cause the foundations of buildings to collapse Flood depth is linked to mortality. In many LICs many people have not learnt to swim . Worldwide c hildren and old people are particularly vulnerable.In LDCs post-flood morbidity is likely due to water borne diseases and secondary flood hazards. In HDCs property values are severely impacted in flood prone areas. Issues also arise when coming to resell properties Structural damage to properties in all countries in a major cause of tangible flood losses Crops, livestock and agricultural infrastructure suffer major damage. Subsistence farmers lose a lot of food supply. In HDCs this can also cause escalating food pricesDestruction of bridges e.g. Cockermouth, Cumbria can make communication between parts of settlements difficult.In NICs growth exceeds flood defence provision so infrastructural loses are highIncome from tourism is disrupted. Floods can recharge groundwater systems, fill wetlands, increase connectivity between aquatic habitats, and move sediment and nutrients around the landscape. Flooding can trigger breeding of species and encourage migration and dispersal. Intense flooding can lead to over supplies of sediment and nutrients, with possible eutrophication and destruction of aquatic plants. Intense flooding can lead to pollution from nitrates, chemicals and heavy metals, all of which degrade aquatic habitats. Socio economic – Red Environmental - Blue

The impact of flooding in England and Wales, summer 2007 http://news.bbc.co.uk/1/hi/uk/7446721.stmhttp://www.metoffice.gov.uk/about-us/who/how/case-studies/summer-2007 http:// nora.nerc.ac.uk/2814/1/N002814BK.pdf Create a case study on the England and Wales folds in Summer 2007 You should include detail on the following: Causes – Hydrological and human – Specific named examples should be used here Impacts – Social, economic and environmental – long and short term (again a range of named examples should be used) Relevant maps, images, graphs should also be incorporated and their relevance explained.

Exam question Construct new meaning With the help of figure 2, explain why the floods occurred in Pakistan in August 2010 (4 marks)

Exam question Construct new meaning With the help of figure 2, explain why the floods occurred in Pakistan in August 2010 (4 marks)

Exam question Construct new meaning Using examples , discuss the impact of flooding on people and the environment (15 marks)

Homework Task Using newspaper articles and publications such as Geofile and Geo Factsheets, research two contrasting flood events (different causes, countries at different levels of development) and prepare a quadrant form diagram to compare the environmental, social and economic impacts both immediately after the event and then short term and long term.

Flood event: Social Impacts Economic impacts Environmental impacts Immediate Short term Long term

Flood event: Social ImpactsEconomic impacts Environmental impacts Immediate Short term Long term

Flood event: Social ImpactsEconomic impacts Environmental impacts Immediate Short term Long term