/
Context19TH CONFERENCE ON COMPETITION AND OWNERSHIP IN LAND TRANSPORT Context19TH CONFERENCE ON COMPETITION AND OWNERSHIP IN LAND TRANSPORT

Context19TH CONFERENCE ON COMPETITION AND OWNERSHIP IN LAND TRANSPORT - PDF document

brooke
brooke . @brooke
Follow
343 views
Uploaded On 2021-06-18

Context19TH CONFERENCE ON COMPETITION AND OWNERSHIP IN LAND TRANSPORT - PPT Presentation

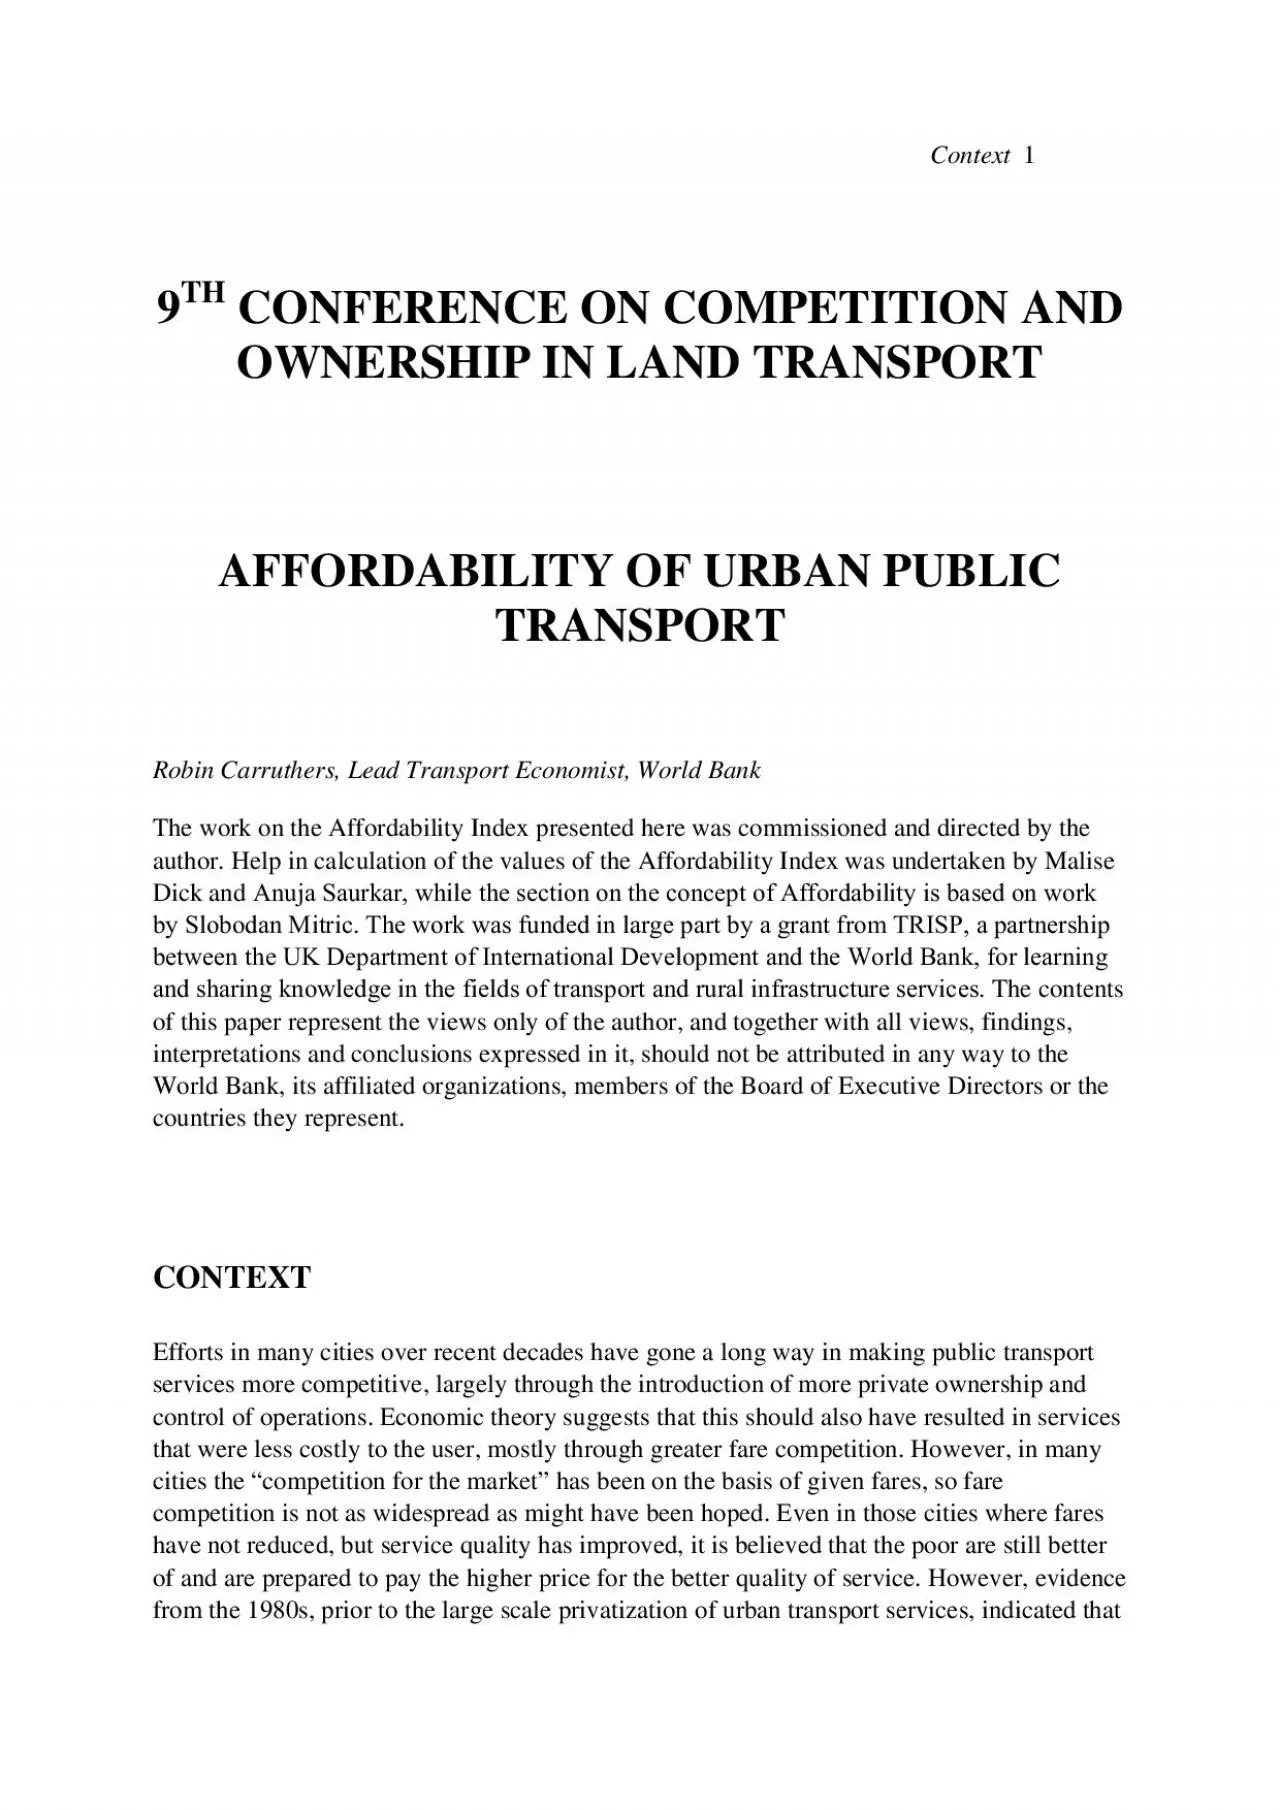
2 Affordability of Urban Public Transport the poor were already paying up to 30 of their gross income on transport Given the other calls on their income and the higher charges for privatized utili ID: 844466

transport income cities affordability income transport affordability cities index fares urban fare public travel average world measures high bank

Share:

Link:

Embed:

Download Presentation from below link

Download Pdf The PPT/PDF document "Context19TH CONFERENCE ON COMPETITION AN..." is the property of its rightful owner. Permission is granted to download and print the materials on this web site for personal, non-commercial use only, and to display it on your personal computer provided you do not modify the materials and that you retain all copyright notices contained in the materials. By downloading content from our website, you accept the terms of this agreement.


Presentation Transcript

1 Context19TH CONFERENCE ON COMPETITION AN
Context19TH CONFERENCE ON COMPETITION AND OWNERSHIP IN LAND TRANSPORT AFFORDABILITY OF URBAN PUBLIC TRANSPORTRobin Carruthers, Lead Transport Economist, World Bank The work on the Affordability Index presented here was commissioned and directed by the author. Help in calculation of the values of the Affordability Index was undertaken by Malise Dick and Anuja Saurkar, while the section on the concept of Affordability is based on work by Slobodan Mitric. The work was funded in large part by a grant from TRISP, a partnership between the UK Department of International Development and the World Bank, for learning and sharing knowledge in the fields of transport and rural infrastructure services. The contents of this paper represent the views only of the author, and together with all views, findings, interpretations and conclusions expressed in it, should not be attributed in any way to the World Bank, its affiliated organizations, members of the Board of Executive Directors or the countries they represent. CONTEXTEfforts in many cities over recent decades have gone a long way in making public transport services more competitive, largely through the introduction of more private ownership and control of operations. Economic theory suggests that this should also have resulted in services that were less costly to the user, mostly through greater fare competition. However, in many cities the “competition for the market” has been on the basis of given fares, so fare competition is not as widespread as might have been hoped. Even in those cities where fares have not reduced, but service quality has improved, it is believed that the poor are still better of and are prepared to pay the higher price for the better quality of service. However, evidence from the 1980s, prior to the large scale privatization of urban transport services, indicated that 2 Affordability of Urban Public Transport the poor were already paying up to 30% of their gross income on transport. Given the other calls on their income, and the higher charges for privatized utility services that has paralleled or even led the privatization of urban transport, it is difficult to see how the poor could afford to allocate a higher share of their income to urban transport. Until recently little attention has been paid to what has actually happened to the level of fares and the use by the poor of urban

2 transport. We are not aware of any syste
transport. We are not aware of any systematic approach to assessing the consequences of introducing more competition on the affordability of urban public transport. A more detailed assessment of some of those cities in which the poor have been observed to pay more for a better quality of services indicates that in many cases fares are still subsidized or controlled at unprofitable levels, so the incidence of the fares of the better quality services is still very low, so they are still affordable to the poor. Our concern is with the cities where the poor do not have the advantage of competing services at low fares, and of the measures that can be taken to make urban public transport more affordable to the poor.CONCEPT OF AFFORDABILITY Urban public transport is often referred to as mass transit. To comply with the mass concept, it must be affordable to the majority of the urban population that have no other way of traveling long distances to work. Among the often quoted four desirable “A”s of urban transport - Accessibility, Availability, Acceptability and Affordability - without the last of these, the other three are irrelevant. But efforts to make mass transit more accessible, available, acceptable - and more profitable – invariably reduce its affordability.The concept of affordability is widely used when discussing urban public transport fares in the presence of low incomes and poverty, but it is not universally accepted as being meaningful. Fare is the dominant feature of public transport services for low-income travelers. In many cities it is the working poor who depend most on urban transport for their livelihood, and that finds urban public transport least affordable. Likewise, it is the key policy variable for both the operating companies and for the government, municipal, regional and even national. As passenger incomes increase, concern over fares starts to be displaced by the concern for the other three “A” s. Traveler reactions to fare increases or decreases are of major interest to operators of transport services, since they affect patronage therefore revenue. This aspect is captured by a standard economic concept of price elasticity, with an established definition, measurement methods, and interpretation. When a fare increase leads to a loss of passengers at the low end of the income scale, the operator is concerned because of the loss o

3 f revenue, but not more than that. Under
f revenue, but not more than that. Understanding the concept and having some knowledge of the values of price elasticity in this context is Concept3necessary for the operator to make informed decisions about setting tariffs (sufficiency includes a requirement to know also about costs).Affordability refers to the same context, but the concern is different and from a different point of view. It is a concern of the society for its least privileged members. When a fare increase could lead to a loss of poor passengers, and the alternatives are few and inferior, access to jobs and services may be reduced, and social interaction may be affected. This chain of events may lead to social and economic exclusion of those at the bottom of the income distribution. This chain of events needs to be taken into account when tariff changes are being considered. So concerns about affordability are clearly nested in the larger subject of poverty impacts of transport policy. The debate about the meaning and usefulness of the concept of fare affordability can be presented by stating two polar positions. Given that we are concerned about the social impacts of the policies that we recommend, the polar minimalist position is not to consider only the impacts on the revenues of the transport operator through the operations of price elasticity. It is rather to treat affordability as an important measure of transport system performance.An affordability index could be defined as the fare expenditure as a percentage of income. The index would be computed for various income groups and the results scrutinized with an open mind as to whether, using the evidence of the proportion on income spent on fares, they are reasonable, high or onerous. The knowledge of affordability indices for the same city at some other point in time, or for other cities in the same country or elsewhere, may provide a useful basis for comparison. Such comparisons can only be made with much caution, since the ceteris paribus assumption cannot be made. At the other end of the range, the approach could be to specify affordability norms to guide policy action. A standard and often cited statement of this approach indicated levels that came to be considered as norms comes from a World Bank report of the late 1980s: “In developing countries, a reasonable level of household expenditure on bus travel should not exc

4 eed 10 percent of household income…… In
eed 10 percent of household income…… In industrial countries , households without cars may spend in the region of 3-5 percent of their incomes on commuting. In developing countries, at the other extreme, studies have found that certain very low-income groups may spend in excess of 30 percent of their income on travel (Nairobi, Sao Paulo)., while levels of expenditures in the region of 15 percent are not uncommon (e.g., Kingston, Jamaica; Calcutta, etc.).1Whether or not the authors meant for the 10% reasonable ceiling to become a norm, it has been treated in this manner by many professionals and by some local governments. In many cases it is not necessarily this particular index value (10%) or any index value, but rather the idea that there is some limit to what is an affordable fare. In these cases the norm would not be expressed in terms of an index value, but as some absolute level of fare produced by the 4 Affordability of Urban Public Transport political process or chosen arbitrarily by someone in the decision making process. In a few cases the norm is applied as the level beyond which subsidies are applied, as with the vale-transporte program in Brazil. In this case when fare expenditures exceed a given percentage of the disposable income of an employee (typically six per cent), the subsidy is applied.While the minimalist approach to use of an affordability index has limited use in informing policy advice, the many difficulties of the normative approach in urban transport are given in a recent urban transport strategy report from the World Bank.2Theoretical and empirical approaches A reasonable approach is to continue using affordability indices as valuable indicators of transport system performance, useful in identifying problems that need to be looked at in more detail. Lest this be thought too modest, it should be remembered that measures of affordability may have some explanatory power but no predictive power, in contrast to elasticity. There are two approaches to developing an index affordability, a theoretical approach based on what it would cost to undertake a given pattern of travel, and an empirical approach based on what an individual actually spends on travel. The Affordability Index described here makes use of the theoretical approach. The empirical approach based on actual expenditure requires a sample drawn from a target popula

5 tion, obtained through travel and/or exp
tion, obtained through travel and/or expenditure surveys and generalized to the population. The results are distributions of expenditure that reflect actual travel experiences, including a full range of coping strategies at the low end of the income scale. We recognize at least two drawbacks to using actual expenditures rather that theoretical expenditures as the basis for compiling Affordability Indices for a comparison between a large number of cities. First, the practical reason that the necessary surveys would be prohibitively costly and time consuming to undertake if the purpose were just to provide data for compiling the index. Second, and more fundamental, the explanatory power of an Affordability Index derived from actual expenditures would be low, due to the multivariate nature and complexity of the underlying behaviors, and problems would arise in interpreting the results. For example, a low actual expenditure by a particular income group in a particular city could indicate that public transport services are provided with such commendable efficiency that fares are such that only a small proportion of income is needed to achieve an acceptable quantity of travel. Or it could indicate that fares are so onerous that members of that income group travel less than average or walk rather than take public transport or decide to live close to their work to avoid having to take public transport. Or it could indicate that fares are heavily subsidized to ensure that only a small proportion of income is needed to travel to work and make a “reasonable” amount of social travel by public transport. The approach that would have to be followed if actual household expenditure were the basis of an Affordability Index would be to analyze values of the Index together with other measures of household economics and transport Concept5system performance, including other information from survey, to derive a more complete sense of how individuals and households are reacting to fare levels. An alternative to using data actual expenditure on public transport derived from surveys is to use “synthesized” data on the number of public transport trips, combined with actual data on fares. A possible scenario would be to postulate a 4-member household, with both adults employed and one child making a school-related trip beyond walking distance. Fare data would be based on a

6 hypothesised travel distance, perhaps ba
hypothesised travel distance, perhaps based on a known average actual trip length.Among the advantages of the “synthetic” approach are that data can be collected relatively easily and at low cost for a large number of cities. Also the assumptions are explicit and fewer in number than using actual expenditure, and a standardized travel pattern is used for all cities. Although this can also be seen as a significant disadvantage since the standardization might be considered totally inappropriate for any particular city, the information value of the resulting Affordability Index can be quite high.This approach is well suited for diagnostic studies, and even as a complement to empirical studies. Finally, the synthetic affordability index is more portable than the empirical one, since the same household and travel scenarios and the same income milestones (e.g. the minimum wage) can be used elsewhere. Index values compiled from different cities are more easy to compare than those based on actual expenditures. The above discussion should not be seen as indicating that either the empirical or synthetic approach is invariably preferable in considering affordability indices, the appropriateness of one or the other depends on the purposes to which the Index is to be put. In our case it is intended as a start in giving a formal recognition of the importance of affordability as an important concept, by indicating what proportion of their income an average and an averagely poor person would have to pay to undertake a global average amount of urban public transport travel. For this purpose an Index based on the synthetic approach is more appropriate than one based on the empirical approach of using actual expenditure. The latter approach is more appropriate when considering the impact of fares on the travel patterns of particular populations rather than in comparing the patterns of populations in different cities. Existing information on affordability At least a dozen studies reported in the last few years have addressed the issue of affordability, some undertaken or commissioned by the World Bank, while most of the others have been written contributions to conferences on urban poverty issues. Each of the studies has taken its own perspective on what income measure to use (income or expenditure based, individual or household income, gross or disposable income etc) a

7 nd on what fare measure to use (actual e
nd on what fare measure to use (actual expenditure in most cases, but theoretical or average expenditure in others), and 6 Affordability of Urban Public Transport most have used a measure of poverty that is specific to the local circumstances (although about half have used a quintile or decile of the income distribution).These differences make it difficult to compare the results between cities, but from studies in South America, South Asia, Eastern and Western Europe, Africa, East Asia and Australasia,it is clear that the affordability of urban transport is considered an issue of importance throughout the developing world. There is also evidence that the high cost of urban transport is having a negative impact on the lives of the urban poor – either through restricting their access to jobs to those that are within feasible walking or cycling distance, by consuming an unsustainable proportion of their income, or by dramatically curtailing the number of journeys that they make. The problem is possibly most grave in Africa, the continent for which there is least documentation. A review of many of these studies is available in a recent (January 2005) publication by the World Bank3.CONSTRUCTION OF THE AFFORDABILITY INDEX The form of the Index we have used is relatively simple, and the data for its compilation is relatively easily available: Affordability Index =Number of trips x Average cost per trip Per capita income expressed as a percentage Estimating values of the Affordability Index requires four pieces of information – a set of cities for which the values of the index are to be estimated, the level of income, the quantity of travel on which the travel cost is to be based, and the level of fares. Set of cities We constructed the index for twenty seven, starting from the one hundred cities included in the Millennium Cities Database for Sustainable Transport (MCD), created by the International Union of Public Transport (UITP)4. The selection was based on the availability of income and fare data. Construction of the Index7Level of income We chose two measures of income, the average per capita income for the whole city population and the average per capita income for those in the bottom quintile of the income distribution. We had intended to use family disposable income for both the average and bottom quintile, but it proved impossible to

8 obtain this information for more than a
obtain this information for more than a small number of cities. Most previous measures of affordability have used only average incomes, whether personal or family, and it is only recently that attempts have been made to measure affordability for the poor as an identified group. There is little reliable and consistent data on the distribution of incomes in cities, and not much more on the distribution of per capita incomes at the country level. Even when there is local information, that often comes from user surveys, and therefore can exclude those with the lowest affordability because they cannot afford to travel. A better source are household surveys, but these tend to categorize income in terms of local parameters. For example, Brazil uses of the number of multiples of the minimum legal income as the basis of income categorization (for example, the poor might be defined as those earning less than three times the minimum income). Other surveys use simple categorizations of “low”, “middle” and “high” incomes, which even when the income ranges are known makes it difficult to translate into the categorization by quintiles of income that are now becoming more standard and used in the World Development Indicators. This source, complied by the World Bank Development Research Group, also uses primary household survey obtained from government statistical agencies and World Bank country departments. We have IMF statistics on national income distributions by quintile, modified to take account of the differences between national and urban incomes as indicted in the Millennium Cities Database. All income levels and fares have been standardized to August, 2004. Quantity of travel Most assessments of the use made of urban transport also rely on household expenditure survey data. The greatest constraint on the use of household survey data that uses actual expenditure is that the indicated expenditure is based on the actual quantity of travel and this already takes account of the impact of any reduction in the amount of travel because of the high level of fares. At one extreme, if fares were so high as to frustrate most travel, the actual expenditure could be quite low. This would not be indication of high affordability of fares, but quite the reverse. For use in a comparative index, we need to use a standard and consistent measure of desired travel that is not in

9 fluenced by the level of fares. The quan
fluenced by the level of fares. The quantity that we have used is derived from a weighted average of all the cities in the Millennium Cities Database for Sustainable Transport (MCD), created by the International Union of Public Transport (UITP),From this database we derived a global average urban public transport trip length of 10km and a global average trip rate of sixty trips per month. For an employed person, this could 8 Affordability of Urban Public Transport comprise about forty six one way trips to and from work and a further fourteen one way trips per month for other reasons – visiting family, seeing a doctor, going to a cinema or undertaking personal business.Level of fares There is no simple and generally recognized definition of what fare should be use in compiling a measure of affordability. Since the Index presented here needs to be consistent between many cities and for the global average trip length of 10km, we have used a standard measure of the fare for a single trip of this distance, based on purchase of daily tickets.We obtained data on fares from official sources and websites, in many cases supplemented by personal contacts through staff in World Bank regional offices. Websites of municipal, and some private, operators often allow fares to be calculated between specific origins and destinations. In these cases, we used sample fares for at least twenty trips of ten kms. With zone fares, a typical zone is less than 10km in radius, which means that two zones have to be crossed. We have made our fare estimates assuming that one zone boundary must be crossed. Where fares are based on times, typical allowances are for one or one and a half hours of travel at the basic fare, and under normal circumstances, this will be sufficient for 10 km to be travelled.All fare information is in current August, 2004 levels. The fares were expressed in local currencies and, for comparability between cities, were translated to US$ at Purchasing Power Parity (PPP) exchange rates.We used the lowest available public transport fares for making a one-way trip. Two features of fares that can impact costs on costs of travel for different sectors of the community are passes and concessions.Typically,passes can be bought for one month, or in some cities for a week or a few days. A comparison of the costs of 60 single tickets with a typical monthly pass

10 indicates a cost saving of as much as 25
indicates a cost saving of as much as 25%. However, this means an “up-front” expenditure of the equivalent of 45 or more single tickets. A recent survey in Sofia, Bulgaria, indicated that only 3% of low-income workers used passes, compared with 14% and 8% of middle and upper income workers respectively. Since people in the poorest income quintile will have difficulty in making the initial payment for period passes we have not taken them into account.Unlike period passes that are available to anyone, concessions are available only to people in specific categories. The structures and incidence of such concessions varies from one city to another, and thus the relationship of the fares actually paid to the nominal fares can vary between cities. However, concession fares are mostly targeted at school children, students and retirees. There are very few cities that have concessions that are available to employed Construction of the Index9people. We have not taken these concessions into account but will do so in the next round of estimation of the Index. This omission is particularly important in Brazil, the country with cities that have the highest values of the Index in its current form.EVIDENCE FROM THE AFFORDABILITY INDEX The results from application of the above method to data from twenty seven cities is shown in the following Table. Table 1 Affordability Index values Per capita Bottom quintile Fare for Affordability Index City income income as 10km travel Average Bottom U$PPP % of average (PPP U$cents) Quintile 1Sao Paulo 8,732 10.0% 130.1 11% 107% 2Rio de Janeiro 14,325 10.0% 125.4 6% 63% 3Brasilia 12,985 10.0% 106.8 6% 59% 4Cape Town 14,452 10.0% 75.8 4% 38% 5B. Aires 15,493 15.5% 87.6 4% 26% 6Mumbai 8,585 41.0% 112.2 9% 23% 7Kuala Lumpur 18,351 22.0% 121.6 5% 22% 8Mexico City 9,820 15.5% 39.3 3% 19% 9Chennai 3,717 41.0% 39.3 8% 19% 10Manila 9,757 27.0% 63.0 5% 17% 11Krakow 15,579 36.5% 130.6 6% 17% 12Amsterdam 28,170 36.5% 226.6 6% 16% 13Moscow 16,154 24.5% 84.6 4% 15% 14Guangzhou 9,165 30.0% 55.1 4% 14% 15Warsaw 26,024 36.5% 142.5 4% 11% 16New York 51,739 27.0% 200.0 3% 10% 17Los Angeles 42,483 27.0% 160.0 3% 10% 18Chicago 48,300 27.0% 180.0 3% 10% 19Singapore 38,797 25.0% 130.3 2% 10% 20Beijing 14,379 30.0% 55.1 3% 9% 21Seoul 16,784 40.0% 85.5 4% 9% 22Shanghai 20,814 30.0% 55.1 2% 6% 23Cairo 7,117 43.0% 26.1 3% 6% 24Budapest 22,106 50.0%

11 89.3 3% 6% 25London 53,057 30.5% 116.4 2
89.3 3% 6% 25London 53,057 30.5% 116.4 2% 5% 26Prague 32,757 52.0% 88.0 2% 4% 27Bangkok 20,386 31.0% 32.2 1% 4% Sources: Income derived from Millennium Cities Database, WB Country Income Data Bottom quintile derived from WB database Fares for 10km of travel derived from internet data and World Bank Country offices 10 Affordability of Urban Public Transport Income distributions For most of the cities included in the Index, the average income is much higher than the national average, so that even for cities in developing countries the average incomes are at levels above those considered as indicating poverty. But the distribution of incomes reveals a different story. From the evidence we have, the poorest 20 % of the population receive well under half the average income in many cities. In only six of the twenty seven cities for which we calculated the Index does the bottom quintile earn more than 40% of the per capita income of the average, and in another six they earn less than 20% of the average. In cities with the lowest incomes in the bottom quintile range, the average income is close to U$2.50 per day. While this is above the values of U$1.0 or U$2.0 per day often used as broad indicators of poverty, these people are living in large cities where the costs of living are also far above the levels in rural areas for which the poverty indicators are most often applied. So an income in the bottom quintile in a city in a developing country is an indication of poverty.FaresThere is a large range between the lowest and highest fares to travel 10km. Not surprisingly, most of the cities with high fares are in developed countries. The only developing country cities with fares of over U$1.00 equivalent to travel 10km are in Brazil, Malaysia and India, with the highest fares in Brazil. At the other end of the scale, the lowest fares are in Cairo and Bangkok at about U$0.30 for 10 km. While a high correlation might be expected between per capita income and bus fare, since a high proportion of the fare is to cover labor costs, the correlation coefficient is only 0.63. However, the correlation between fare and bottom quintile income is much higher at 0.89, perhaps indicating that many public transport employees are paid at closer to the bottom quintile than to the average income. Affordability Index for people on an average income The percentage of average in

12 come spent on public transport varies su
come spent on public transport varies substantially from city to city. At one extreme is Bangkok, where only about 1% of city average income is required to obtain the public transport services as previously identified (10km trip, 60 trips per month).The reasons are low cost bus systems, combined with a comparatively high average income level. At the other extreme is Sao Paulo (Brazil) where some 11% of average income would be necessary to undertake the standard quantity of public transport travel. The high value is mostly attributable to the need to pay for more than one ticket for a typical 10km journey, and the lack of combination tickets. In between are a range of cities where the two factors – fares and income levels – interplay to varying degrees. Although fares vary significantly from city to city, they do so to a lesser Evidence from the Index11extent than per capita incomes. So while there is some evidence, of an inverse relationship between per capita income and the value of the Index, it is not statistically significant. Affordability Index for people in the bottom quintile of the income distribution For some of the cities in the sample, the values of the Affordability Index for people in the bottom quintile income group are unsustainable at over 30% of their income. Either they are having to curtail their amount of public transport travel, and therefore the also curtail the activities that generate the need to travel, or they are not paying the full fare, or their travel to work is much shorter than 10kms.For the three Brazilian cities included in the sample there is a federally mandated subsidy which requires employers to pay the difference between 6% of salary and cost of home to work trips for formal employees (the “vale transporte”). But we also know that in Brazil a large number of people, probably mostly in the bottom quintile of the income distribution, are either self employed or are employed in the informal economy and therefore not eligible for the concession fares. The very high proportions of income indicated for the poor to travel in Brazil confirms what has been learned from several other recent studies. A review of the potential impact of the new Line 4 of the Sao Paulo metro made for the World Bank in 20035showed that the poor were spending between 18% and 30% of their income on travel, while only making one third the

13 number of daily trips of those in the h
number of daily trips of those in the highest income group. In Cape Town, the suburban rail service is less costly than the bus service but is ignored by many potential passengers because of security concerns. As in many other cities, mini-buses are also available but at a higher fare. Buenos Aires, the other city with a very high Index value for its bottom quintile income earners, at least has a reliable and relatively safe bus system that operates at high frequencies, even into the night. But particularly when considered together with the tariffs for other utility services6, the fare level is probably unsustainable in the long term for this income group. Even some of the cities in developed countries have high values for the Index, a consequence of their very high fares and/or relatively skewed income distributions. A comparison of the Index values for people on average incomes and on bottom quintile incomes is also instructive. The average value of the ratio of the Index values is 4.0, with the highest being over 10.0 and the lowest 2.0. The correlation between the two Indices is 0.73, not as high as might be expected and indication of very skewed income distributions in many of the cities since the value of the ratio is only determined by the income distribution. Brazilian cities have the most skewed distributions in the sample, while East European and Indian cities, together with Cairo and Seoul have the least skewed distributions. The bottom quintile of the income distribution includes a high proportion of adults who are working and therefore not eligible for concession fares that are usually only available for children, students and people of pensionable age. Unless there are other concessions available 12 Affordability of Urban Public Transport to them (as for some bus fares in Brazil or other expenditures such as household rent in other countries) the indicated values of the Affordability Index are sufficiently high to raise concerns that the fare levels are unsustainable for themFURTHER WORK In addition to expanding the number of cities included in the Index, and correcting the existing values, the next stage of our work is to review financial and operational efficiency of some of the most widely used measures to make urban public transport more affordable. Efficiency of measures to improve affordability While there is a wealth of inform

14 ation available on measures taken to mak
ation available on measures taken to make urban transport more affordable, this is not organized or presented in a consistent way, and often does not discuss the targeting and cost efficiencies of the measures. In particular, it seldom takes advantage of the simple methodologies developed by poverty experts to evaluate targeting performance of subsidies.A first step in assessing the impact of measures to improve the affordability of urban public transport has been to review the measures commonly used to measure the efficiency of utility subsidies, although many of the measures that can be used to increase affordability do not explicitly involve subsidies. One of the clearest explanations of indicators of the efficiency of utility subsidies is given in a forthcoming World Bank report on utility subsidies,7 and it is the explanation given there that we will use in assessing the efficiency measures. The index most frequently used measure of the efficiency of utility subsidies is , a measure of the amount of he cost of the subsidy that is received by the target population. This index is perceived as being important, as it is believed that a very high proportion of the costs of many utility subsides “leak” to populations that do not need them. Another index, E, is an important corollary in considering the efficiency of a subsidy, but much more difficult to quantify and therefore frequently overlooked. It is the proportion of the target population that is able to take advantage of the subsidy. In this further work on measures to increase the affordability of urban transport, we will attempt to measure the index values for some of the measures that appear to be most promising. We have categorize the types of measure that can be used to improve affordability. The categorization is shown in Table 2, while Table 3 shows some cities that have applied particular measures according to the typology. These are the cities and measures that will be assessed and reviewed in our further work. Further work on Affordability13Table 2 Categorization of Measures a) Typology of measures Non subsidy measures1.More competition and quality regulation 2.Transport management, including bus priority measures 3.Transfer ticketing 4.Road pricing revenue transfers Subsidy measures5.Fare regulation 6.Fare policy (fixed system fare) 7.Fare subsidy to targeted users (students, pensi

15 oners, disabled etc)8.Income support to
oners, disabled etc)8.Income support to employeesIndirect measures9.Improve physical access to public urban transport 10.Housing subsidies 11.Land use planning b) Characteristics of measures Who is the immediate beneficiary of the measure? ipassengersiioperators iiiothers Who pays for the measure? iother passengers,iioperator,iiimunicipality,ivemployervother Is the measure: iTargetediiGeneral 14 Affordability of Urban Public Transport Table 3 Cities/Countries that have adopted specific measuresNon subsidy measuresi.More competition and quality regulation Uzbekistan, Kazakhstan ii.Transport management, including bus priority measures Guangzhou, Dhaka,iii.Transfer ticketing London, Paris, Madrid. Amsterdam, Washington iv.Road pricing revenue transfers London, Singapore and Trondheim Subsidy measuresv.Fare regulation Cairo, Mumbai, Madridvi.Fare policy (fixed system fare) Wuhan, Buenos Aires, Sao Paulo vii.Fare subsidy to targeted users (students, pensioners, disabled etc) Paris, London, Madridviii.Income support to employeesBrazil (vale transporte), France Indirect measuresix.Improve physical access to public urban transport Kyrgyz, Manila, Lima,x.Housing subsidies Sofia, Bucharest xi.Land use planning Curitiba, Singapore Further work on Affordability15REFERENCES1 Armstrong-Wright, A and Thiriez, Sebasatien (1987). Bus Services - Reducing Costs, Raising Standards", World Bank Technical Paper No. 68, The World Bank, Washington, DC, 2 World Bank (2002). Cities on the Move: A World Bank Urban Transport Strategy Review Washington, DC, 2002.3 Carruthers, R, Dick, M and Saurkar, A (2005) Affordability of Public Transport in Developing Countries, Transport Paper 3, World Bank, Washington, DC. 4Millennium Cities Database,http://wwwistp.murdoch.edu.au/publications/projects/uitpmill/uitpmill.html5Barone, R. and Rebelo, J. (2003)Potential impact of metro’s Line 4 on poverty in the Sao Paulo metropolitan region,World Bank, http://www.worldbank.org/transport/urbtrans/poverty_14_sp.pdf6 Foster, V, (2003) Impacto Social de la Crisis Argentina en los Sectores de Infraestructura, World Bank, Centro de Estudios Económicos de la Regulación (CEER) and the Universidad Argentina de la Empresa (UADE), Washington, DC 7 Komives, K, Foster.V, Halpern, H, and Woden Q.(2005) Who Benefits from Utility Subsidies? Water, Electricity and the Poor, World Bank, Washington, D.C