/
VALIDATION AND APPLICATION OF THE REKODIREKT CODE FOR THE SIMULATION O VALIDATION AND APPLICATION OF THE REKODIREKT CODE FOR THE SIMULATION O

VALIDATION AND APPLICATION OF THE REKODIREKT CODE FOR THE SIMULATION O - PDF document

caitlin
caitlin . @caitlin
Follow
343 views
Uploaded On 2021-06-30

VALIDATION AND APPLICATION OF THE REKODIREKT CODE FOR THE SIMULATION O - PPT Presentation

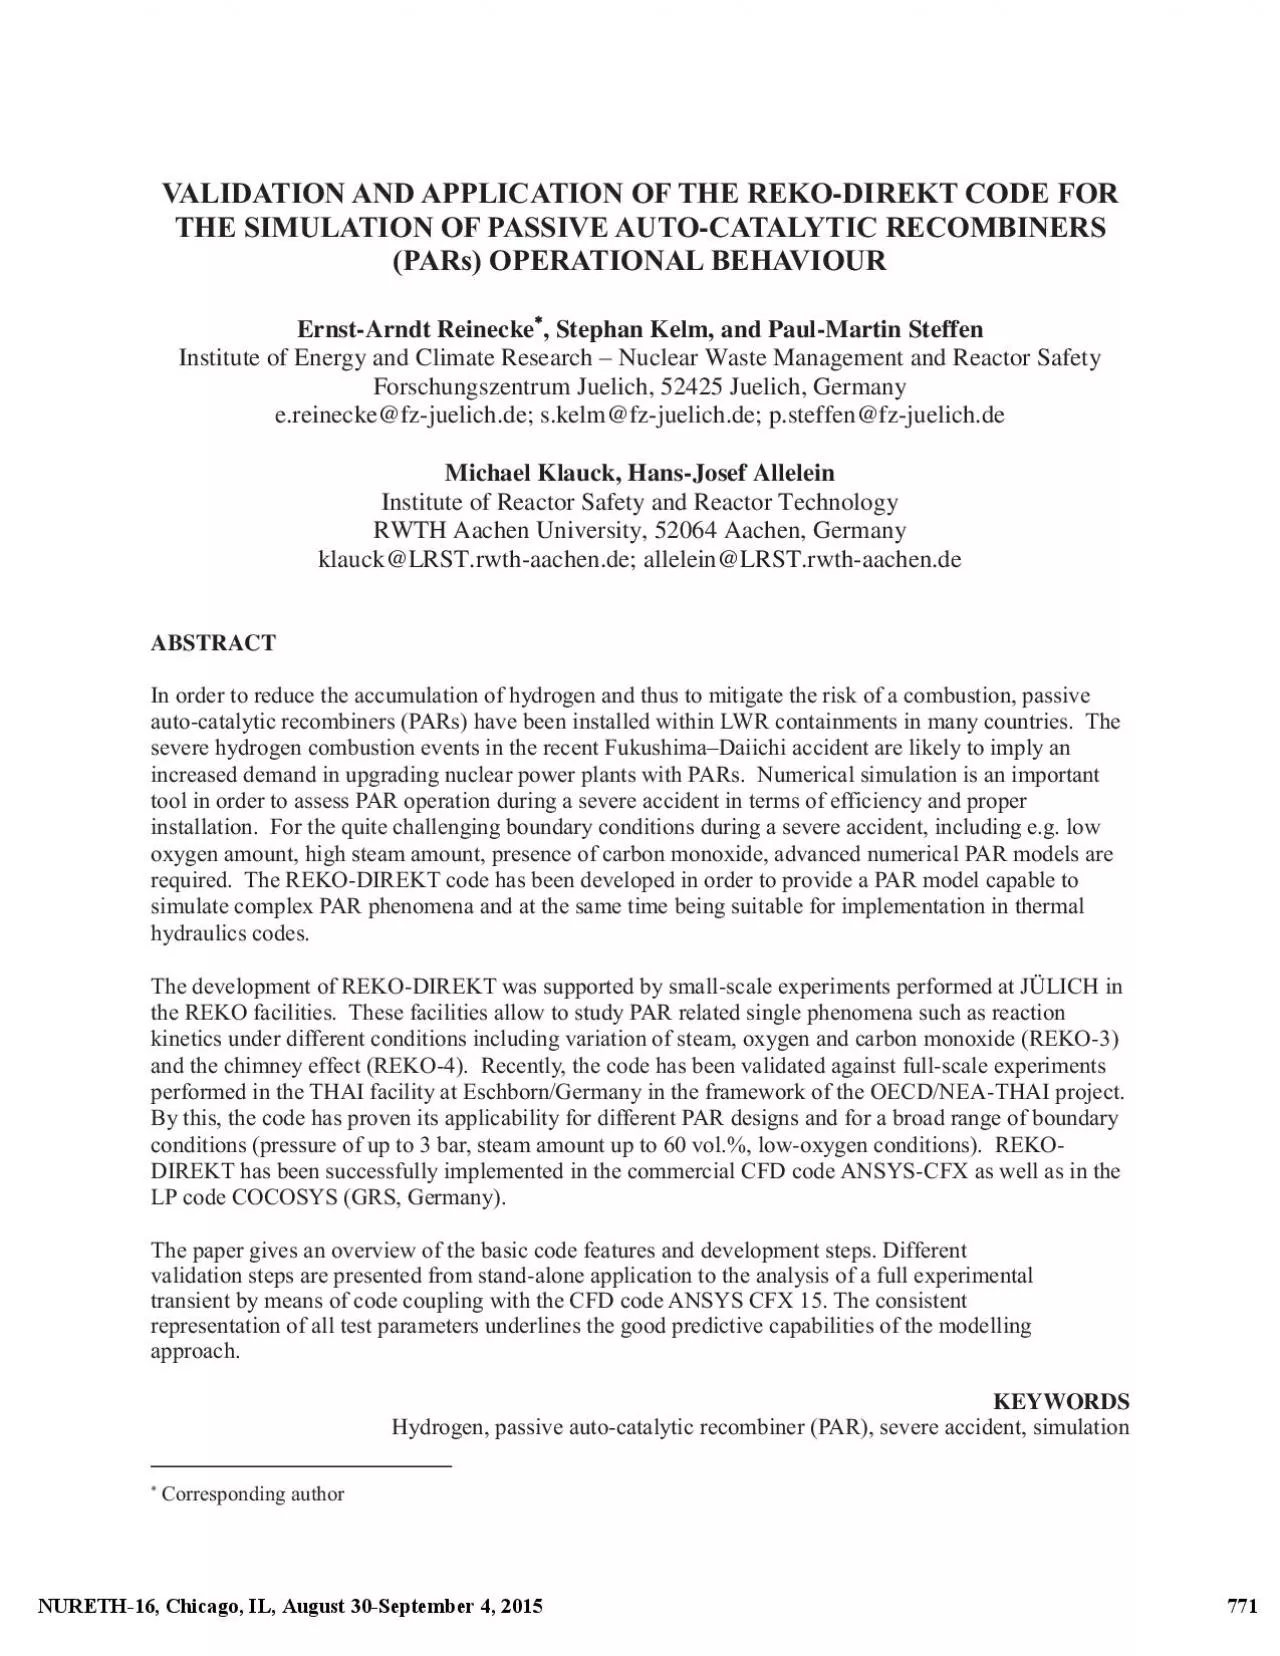
2 Stephan Kelm and PaulMartin Steffen Institute of Energy and Climate Research Corresponding author 771NURETH16 Chicago IL August 30September 4 2015 INTRODUCTION Passive autocatalytic ID: 850323

catalyst par gas hydrogen par catalyst hydrogen gas validation flow fig temperature data calculated model vessel test inlet code

Share:

Link:

Embed:

Download Presentation from below link

Download Pdf The PPT/PDF document "VALIDATION AND APPLICATION OF THE REKODI..." is the property of its rightful owner. Permission is granted to download and print the materials on this web site for personal, non-commercial use only, and to display it on your personal computer provided you do not modify the materials and that you retain all copyright notices contained in the materials. By downloading content from our website, you accept the terms of this agreement.


Presentation Transcript

1 VALIDATION AND APPLICATION OF THE REKODI
VALIDATION AND APPLICATION OF THE REKODIREKT CODE FOR THE SIMULATION OF PASSIVE AUTOCATALYTIC RECOMBINERS (PARs) OPERATIONAL BEHAVIOUR Ernst-Arndt Reinecke  , Stephan Kelm, and Paul-Martin Steffen Institute of Energy and Climate Research Corresponding author 771NURETH-16, Chicago, IL, August 30-September 4, 2015 INTRODUCTION Passive autocatalytic recombiners (PARs) are the key element for the mitigation of combustible gases during a severe accident in LWRs in many European countries [1]. The proper implementation of PARs inside the containment (required number of units, optimum location) depends on expert judgement supported by numerical tools enabling the simulation of PAR operation inside the containment under the boundary conditions of a severe accident.In the last decades, different modelling approaches have been developed in order to describe the operational behavior of PARs in terms of achievable hydrogen conversion rates. More recently, modelling approaches have emerged from simple parameter models towards more detailed and mechanistic models [2]. One of these approaches is the REKODIREKT code developed at JÜLICH.The modelling approach of the REKO-DIREKT code (Fig. 1) includes two basic elements: PAR operation is modelled as the interaction of the recombiner chimney and the catalyst section. The chimney induces a vertical buoyant flow which can be described as a function of the density difference between the hot gas inside the chimney and the cold gas outside the PAR box. The resulting mass flow is transferred to the catalyst section model where heat and mass transfer occurring between the catalyst sheets and the bulk flow are calculated. For this purpose, the catalyst geometry is reduced to one single channel formed by two catalyst plates. The catalytic reaction is described with a mass transfer approach, i.e. species diffusion through the boundary layer is assumed to be the relevant reaction step and no chemical reaction on the catalyst sheets is

2 calculated. A detailed description of m
calculated. A detailed description of modelling the catalyst section is given in [3], while the chimney model is described in detail in [4]. Figure 1. REKODIREKT general modelling approach.The principal development strategy is illustrated in Fig. 2. The development of REKODIREKT has been supported by experiments which have been performed in the REKO test facilities at JÜLICH. REKOtests aimed at investigating the steadystate conversion rates and catalyst temperatures of the catalyst section [5]. REKO4 tests were performed in order to optimize the chimney model [4]. In REKOspecific phenomena e.g. the ignition potential at hot catalyst sheets have been studied [6]. In order to use REKODIREKT for numerical scenario analyses, the code has been successfully coupled to CFX (ANSYS) [7] and more recently to COCOSYS (GRS) [4]. While the latter coupling is still under validation, the application with CFX is already successfully applied in simulations of PAR operation. 772NURETH-16, Chicago, IL, August 30-September 4, 2015 Figure 2. REKODIREKT: Development, validation and application.CODE DEVELOPMENT A comprehensive experimental program has been performed … and is still ongoing … in order to understand PAR operational behavior and to support model development (Tab. I). The test matrix includes basic PAR operation (dry atmosphere, chimney effect) as well as challenging conditions as expected to occur during a severe accident including high humidity, oxygen starvation, and presence of carbon monoxide. Table I. Experimental program on PAR behaviorThe numerical model of the catalyst section includes a mass transfer approach for the catalytic reaction of hydrogen and carbon monoxide with oxygen. At the same time, heat transfer by conduction, convection, and heat radiation between the catalyst sheets is taken into account. The corresponding energy balance is solved for one single gas channel limited by two catalyst sheets on each side (Fig. 3). In order to provide s

3 uitable data for model optimization, the
uitable data for model optimization, the temperature distribution on the catalyst sheets as well as the hydrogen and carbon monoxide depletion along the catalyst sheets are measured under welldefined boundary conditions inside the REKO3 test facility (Fig. 4, left) which represents a PAR section with four catalyst sheets. Fig. 5 shows typical steadystate measurement data. The model provides very good overall agreement with the experimental data base. 773NURETH-16, Chicago, IL, August 30-September 4, 2015 Figure 3. Mass and heat transfer inside the catalyst section.Figure 4. REKO3 facility (left), REKO4 facility (right).Figure 5. Typical REKO3 data (catalyst temperature, gas outlet concentration): measurement points (symbols) and REKODIREKT calculation (lines) [8]. 774NURETH-16, Chicago, IL, August 30-September 4, 2015 The chimney model is based on the momentum balance for a vertical chimney. Main model parameters are here the flow resistances at the PAR inlet, outlet, inside the catalyst section and inside the chimney. Experiments for model optimization have been performed inside the REKO4 test vessel (Fig. 4, right) using different chimney designs [4]. Calculated flow velocities are in good agreement with the experimental data. Fig. 6 shows representative results for experiments at a vessel pressure of 1.5 bar. Figure 6. Comparison of measured and calculated flow velocities at the PAR inlet [4].CODE VALIDATION In the frame of the OECD/NEATHAI and THAI2 projects [9], a total of 37 experiments using different PAR types provided by the manufacturers AREVA, NIS, and AECL have been performed (HRŽ test series). As these PARs differ in design and size, these experiments provide a comprehensive data base for the validation of both standalone PAR codes as well as coupled PAR/thermal hydraulics codes under a broad range of boundary conditions. Consequently, the data has been used for validation of the REKODIREKT code and demonstration of the versatility o

4 f the code for fullscale PAR application
f the code for fullscale PAR application. 3.1. Description of the Experimental Database The THAI facility, operated by Becker Technologies in Eschborn/Germany, is a cylindrical vessel with a free volume of approx. 60 m³ (Fig. 7). Hydrogen is injected through a ring feed line located at the vessel bottom. Higher pressures up to 3 bar are realized by additional air injection. The vessel atmosphere may be heated by steam and by the vessel walls. Additional steam and oxygen injections are performed as required by the corresponding test matrix [9]. During the HR tests, the PAR is attached to the outer wall of the inner cylinder. Each PAR is equipped with an instrumented inlet channel which has the same flow cross section as the corresponding PAR.Most of the experiments are performed according to the following procedure: Hydrogen is injected up to a concentration where no ignition is presumed to occur. After reaching the target concentration, the injection is stopped and the recombination process continues until a small amount of residual hydrogen is left inside the vessel. Then, the second injection starts and is maintained until ignition at the PAR occurs. Injection is stopped and the recombination process continues until hydrogen is almost completely consumed except for small residual amount 0.5 vol.%. A few tests differ from the procedure described 775NURETH-16, Chicago, IL, August 30-September 4, 2015 above in order to investigate specific phenomena such as multiignition or startup and operation under oxygen starvation conditions. Figure 7. THAI vessel (right) and experimental setup (left) [9].The HR test series can be roughly grouped according to the following test parameters:Initial vessel pressure (1.0 … 3.0 bar) Steam amount (0 … 60 vol.% corresponding to elevated temperatures) Tests where partially or permanently the oxygen concentration is below the required minimum for optimum hydrogen conversion (oxygen starvation). Tests where

5 ignitions were intentionally provoked.A
ignitions were intentionally provoked.A number of 32 of these tests are used in the present code validation. In the present study, only PARs of AREVA and AECL design are taken into account as the used catalyst sheets are directly suited for modelling with REKODIREKT. Modelling NIS PARs which contain cassettes filled with catalyst pellets requires pretests with original material. The full database of each test includes measurements of the THAI vessel (wall temperatures), the vessel atmosphere (gas temperatures, gas concentrations, total pressure), and the PAR (gas temperatures, gas concentrations, catalyst temperature, flow velocity). The most relevant measurements at the PARs are (see Fig. 8):Gas temperature at the PAR inlet (KTFin) and outlet (KTFout) as well as immediately above the catalyst sheets (KTFgas) Catalyst temperatures (KTWcat) at different positions of the catalyst sheetsHydrogen concentration at the PAR inlet (KCHin) and outlet (KCHout)Oxygen concentration at the PAR inlet (KCOin)Flow velocity at the PAR inlet (KVTin) PAR box temperature (KTBin, KTBout) 776NURETH-16, Chicago, IL, August 30-September 4, 2015 Figure 8. Instrumentation of AREVA PAR (left) and AECL PAR (right) [8]; boxes indicate data used for code validation (blue: input data, green: output data).3.2. REKO-DIREKT Validation (stand-alone) For the calculation of the HR tests, the required input data retrieved from the experiments are the gas temperature and gas composition at the PAR inlet as well as the pressure. As an example, the results of two tests are discussed in detail (HR3 for the AREVA PAR, HR19 for the AECL PAR). Finally, the validation results for all test calculations are summarized. Test HR3 starts at dry atmosphere while test HR19 includes a 25 % steam atmosphere. Both tests are performed at an initial pressure of 1.5 bar. Fig. 9 (top) shows the history of hydrogen concentration measurements. The hydrogen injection into the THAI vessel causes an almost linear increase o

6 f the hydrogen concentration at the PAR
f the hydrogen concentration at the PAR inlet (blue). After injection stops, PAR operation causes the hydrogen concentration to decrease. The three concentration measurements at the PAR outlet follow the inlet concentration value until the recombination reaction starts. For the AREVA PAR, the agreement between calculation (black) and measurement is very good over the whole experimental time period. For the AECL PAR, the measurement values differ quite significantly. Although the calculated values (black) are within the measurement range, an estimation of the quality of the calculation is not possible.The course of the experiment is further illustrated by the history of the catalyst temperature measurements (Fig. 9, middle). The startup of the exothermal hydrogen reaction causes a steep increase in the catalyst temperature. For the AREVA PAR, the catalyst temperatures measured at the lower edge of three different catalyst sheets (see Fig. 8) show quite similar values. The calculated maximum temperature (black) is in very good agreement and only slightly underpredicts the peak value of the injection phase. Major deviations are visible during the hydrogen depletion phase where the catalyst temperatures decrease too slowly in the calculation. This kind of deviation can be found in all calculated HR tests. For the AECL PAR, the calculated catalyst temperatures are in reasonable agreement with the values measured at different catalyst positions (see Fig. 8) during the whole transient. The comparison of measured and calculated flow velocities at the PAR inlet is given in Fig. 9 (bottom). The flow velocity rises steeply after the start of the reaction and reaches its peak value at the end of the injection phase. Although deviations exist during the startup phase, the calculated peak values as well as the values during the depletion phase (black) are generally in good agreement for both PARs. 777NURETH-16, Chicago, IL, August 30-September 4, 2015 Figure 9. Measured vs. c

7 alculated data (HR3, left and HR19, righ
alculated data (HR3, left and HR19, right). 778NURETH-16, Chicago, IL, August 30-September 4, 2015 In order to assess the overall performance of REKODIREKT taking into account the entire HR database, the peak values at the end of the injection phase (see Fig. 9) of the relevant parameters hydrogen outlet concentration, maximum catalyst temperature, and flow velocity of all tests are compared with the calculation results. A small number of experiments which didnt include an injection peak are not represented in this assessment. Fig. 10 (top left) shows the comparison of measured and calculated outlet hydrogen concentrations. For both PAR types, an average value of the concentration measurements has been used. The diagram shows very good agreement for the AREVA PAR (open symbols), for most tests within +/ 10 %. Only test HR13 is far out of range. For the AECL PAR (closed symbols), the deviation towards the measurements is within the range of up to 15 %. Calculations of experiments with and without steam reveal similar deviations. In Fig. 10 (top right), measured and calculated maximum catalyst temperatures are compared. The agreement of the calculated results is excellent for tests in dry atmosphere (squares) for both PAR types. For tests with steam (triangles), the experimental data are systematically overestimated in the approximate range of 10 … 15 %. The reason for this systematic deviation might be neglecting the heat radiation adsorption of steam between the catalyst sheets in the model. Measured and calculated flow velocities are compared in Fig. 10 (bottom). The deviation of most of the calculated results is well below 10 %. As for the calculated hydrogen concentrations, no systematic discrepancies for experiments at elevated pressure or at high steam amount can be observed.Figure 10. Calculated vs. measured data for tests with AREVA and AECL PARs. 779NURETH-16, Chicago, IL, August 30-September 4, 2015 3.3. Validation of the Coupled RD-CFX Ap

8 proach In order to simulate PAR operatio
proach In order to simulate PAR operation as well as its interaction with the hydrogen transport inside containment compartments, RD has been coupled explicitly to the commercial CFD code ANSYS CFX 15 [10]. Data handling between RD and CFX is performed by means of the CFX Memory Management System (MMS), which can be accessed by both codes. The coupling is performed on a masterslave base, i.e. the RD execution is fully controlled by CFX. For this purpose, the program flow of RD has been modified to run only a single time step for each call. All variable fields are stored in the MMS and read out as an initialization for the next RD call. Figure 11 illustrates the domain decomposition and interface data handling of RD and CFX. Basically, the full PAR can be modeled by RD, while for the THAI validation the flow inside the chimney is resolved by CFX in order to allow for a consistent representation of the exhaust gas plume.The necessary input parameters for a RD run are provided by CFX. Besides the geometrical information of the PAR and the CFD time step size these are the averaged gas composition and temperature at the PAR inlet cross section as well as the absolute pressure level. Based on this information, RD predicts the gas, catalyst and box temperature, the change of the gas composition along the catalyst sheets as well as the gaseous mass flow through the PAR. This mass flow and PAR outlet conditions are fed back to the CFX simulation afterwards. The heat transfer rate between gas and PAR box is calculated based on the averaged PAR box temperature, provided by RD and handed back as an input to the RD.Figure 11. Principle domain decomposition and interface data handling for large scale application (left) and detailed resolution of the chimney flow used for the THAI validation (right).A more detailed description of the code coupling and data management is given in [11]. The CFD approach based on the SST model used to predict the transport and mixing of hydrogen

9 has been extensively validated for conta
has been extensively validated for containment typical flows e.g. [12], [13] or [14]. The systematic assessment of the coupled approach is performed in based on the validation of the standalone version in two further steps: A simple 2D channel domain allows to prescribe the PAR inlet conditions according to the experiment. In comparison with the standalone version any effects of the coupling on the results can be identified. It also provides reference results in order to separate possible discrepancies in the CFD model of the hydrogen mixing in the 3D THAI test transient. In order to allow for a separation of different 780NURETH-16, Chicago, IL, August 30-September 4, 2015 process parameters, the validation scheme includes five tests with increasing complexity out of the THAI HR data base for AREVA PARs:HR2 / HR3 / HR5 effect of pressure in dry atmosphere,HR12 effect of humid atmosphere and late oxygen starvation,HR35 effect of early oxygen starvation.Based on the simplified geometry (Fig. 7, right), two hexahedral grids have been built (Fig. 12) taking into account the common Best Practice Guidelines ([15], [16] and [17]) as well as code specific recommendations [10]. The grids are refined in the vicinity of the PAR and above the H feed line considering the gradients due to the rising H rich plume and the PAR in and outflow. In the sump and the upper free volume of the facility, the mesh is evenly distributed. The standard grid is used for the majority of validation runs, while the reference grid, refined by a factor of ~2 in each spatial direction, is used in order to prove grid independency of the CFD solution.Figure 12. THAIHR grid hierarchy: standard grid (left), reference grid (right).The atmospheric transport and mixing processes inside the THAI vessel are described by an unsteady Reynolds Averaged Navier Stokes (URANS) approach, closed by ideal gas equations of state and the kbased shear stress transport (SST) turbul

10 ence model. The latter includes addition
ence model. The latter includes additional terms in order to describe turbulence production and dissipation due to buoyancy. Species mixing is considered by additional transport equations for H, O and HO. The mixture properties and molecular diffusion coefficients are evaluated depended on mixture temperature and composition according to [18]. The model considers conjugate heat transfer, i.e. it represents the relevant heat capacities of the vessel walls and the inner cylinder. Heat losses through the insulated vessel walls are considered by means of an effective heat transfer coefficient of 0.75 W/m²K at the outer boundary. Radiative and convective heat exchange between the PAR box and the gaseous atmosphere is modeled by means of a Monte Carlo radiation model. Wall condensation is represented based on a single phase diffusion layer model. The hydrogen injection is modeled by means of an inlet boundary condition and a prescribed timedepended injection rate and temperature according to the experimental transient. Gas sampling of in total 600 l/h is considered by means of 16 volumetric continuity sink points at the corresponding measurement positions. The PAR itself is modeled by means of an inlet and outlet boundary condition (mass flow, gas temperature and composition) and a thermal wall boundary condition, which is delivered by the RDCFX 781NURETH-16, Chicago, IL, August 30-September 4, 2015 interface. The only physical input data defined for REKODIREKT are the geometric dimensions of the PAR. In order to allow a better comparison of experiment and simulation, the PAR startup is artificially defined according to the experimental timing and not, as usual, by means of a minimum concentration of reactants. The very good predictive capabilities of the coupled approach are demonstrated by means of the test HR12, performed at elevated pressure of 3 bar gas temperature of ~120 °C and relative humidity of 60 %. Due to the low oxygen content, oxygen starvation occurs

11 after the second injection of hydrogen.
after the second injection of hydrogen. Considering the transport of O and H to the PAR inlet, the resulting conversion rate and heat release (Fig. 13) characterized by the exhaust gas temperature.Figure 13. HR12: Comparison of PAR inand outlet concentrations (left) and resulting reaction rate (middle) and PAR temperatures (right).The buoyancy driven chimney flow induced by the hot exhaust gas is predicted in good agreement with the measured inlet velocity (Fig. 14, left). The buoyant flow inside the facility is rather complex, however it is identified that the concentration and gas temperature levels in the dome region, inside the inner cylinder, the annular compartment and the vessel sump are well predicted. The overall vessel pressure is over predicted with increasing time which indicates a slight discrepancy in the gas to wall heat transfer.Figure 14. HR12: Comparison of PAR inlet velocity (left), vessel atmosphere temperature and pressure (middle) and hydrogen distribution inside the vessel (right). 782NURETH-16, Chicago, IL, August 30-September 4, 2015 The presented test scenario, as well as the others considered in the validation scheme, are predicted quite consistent to experimental transient regarding all available measurements as well as derived quantities like the recombination rate. Even though a systematic comparison was performed minor deviations to the measurements remain but dont follow a systematic manner. In particular for the humid tests, heat radiation of hot steam revealed to be the dominant mechanism for the heat transfer between gas and structures and needs to be modeled as carefully in order to achieve a consistent prediction of the gas temperature and pressure level.CONCLUSIONS The experimental program performed in the frame of the OECD/NEA projects THAI and THAI2 offers a comprehensive data base which is especially suited for the validation of numerical PAR codes. In the framework of the validation of the PAR code REKODIREKT, a

12 total of 32 experiments of both test pr
total of 32 experiments of both test programs including two different PAR types (AREVA and AECL) have been simulated. Taking into account the broad parameter field including pressures between 1 bar and 3 bar, steam concentrations up to 60 vol.% and lowoxygen conditions as well as the significant differences of both PAR types geometries, the results achieved are highly convincing and confirm the suitability of the code for the simulation of the operational behavior of fullscale PARs. The implementation of REKODIREKT in ANSYS CFX 15 allows consistent simulation of experimental transients regarding all available measurements as well as derived quantities like the recombination rate. In continuation of the presented validation program, ongoing experiments are focused on understanding the gasphase ignition on hot catalyst sheets as well as catalyst poisoning by carbon monoxide and by cable fire products. Furthermore, the influence of adverse flow conditions (e.g. counter flow) on the startup behavior of PARs is investigated. Consequently, these phenomena are foreseen to be included in the next development steps of the numerical PAR model REKODIREKT. ACKNOWLEDGMENTS The authors gratefully acknowledge the support of all the countries and the international organizations participating in the OECD/NEA THAI project, in particular the members of the Management Board and the Program Review Group. They would also like to thank the staff of Becker Technologies for preparing, performing and documenting the experiments. Furthermore, the authors would like to thank the German Federal Ministry for Economic Affairs and Energy for funding the presented code validation (project no. 1501394). The development of CFD models for prediction of H2 mixing and mitigation as well as parts of REKO3 / 4 experimental program and REKODIREKT code development are funded by the German Federal Ministry for Economic Affairs and Energy (project nos. 1501407, 1501308 and 1501394). REFERENCES Z. Li

13 ang et al., Status report on hydrogen ma
ang et al., Status report on hydrogen management and related computer codes, NEA/CSNI/R (2014) 8. A. Reinecke, A. Bentaïb, S. Kelm, W. Jahn, N. Meynet, C. Caroli, Open issues in the applicability of recombiner experiments and modeling to reactor simulationsŽ, Progress in Nuclear Energy 52 (2010) 136…147. 783NURETH-16, Chicago, IL, August 30-September 4, 2015 J. Boehm, Modelling of processes in catalytic recombiners, Forschungszentrum Jülich, Energy Technologies 61 (2007). B. Simon, M. Klauck, D. Heidelberg, H.J. Allelein, E.A. Reinecke, E. Thesing, E. Bendel, A. Vos, Enhancement and validation of models describing the operational behaviour of passive autocatalytic recombiners in the containments of nuclear power plantsŽ, Reactor safety research project 1501394, Final report (2014). A. Reinecke, J. Böhm, P. Drinovac, S. Struth, I.M. Tragsdorf, Numerical and experimental investigations on catalytic recombinersŽ, Proc. 13th Int. Conf. on Nuclear Engineering ICONEBeijing, China, May 1620, 2005, ICONE1350267. N. Meynet, A. Bentaïb, E.A. Reinecke, S. Kelm, H.J. Allelein, Progress in PARs modeling for reactor applicationŽ, Proc. European Review Meeting on Severe Accident Research ERMSAR2013, Avignon, France, October 24, 2013. S. Kelm, E.A. Reinecke, W. Jahn, H.J. Allelein, Simulation of PAR Operation in Compartments Coupling of REKODIREKT and CFXŽ, Proc. 2nd International Meeting on the Safety and Technology of Nuclear Hydrogen Production, Control, and Management, San Diego, CA, June 1317, 2010. M. Klauck, E.A. Reinecke, St. Kelm, N. Meynet, A. Bentaïb, and H.J. Allelein, Passive autocatalytic recombiners operation in the presence of hydrogen and carbon monoxide: experimental study and model developmentŽ, Nuclear Engineering and Design, 266, pp. 137147 (2014). T. Kanzleiter, S. Gupta, K. Fischer, G. Ahrens, G. Langer, A. Kühnel, G. Poss, Hydrogen and fission product issues relevant for c

14 ontainment safety assessment under sever
ontainment safety assessment under severe accident conditionsŽ, OECD/NEA THAI project final report 1501326…FR 1 (2010).ANSYS, Inc., ANSYS CFXSolver Theory Guide and Solver Modeling GuideŽ, Release 15, Canonsburg, October 2013S. Kelm, E.A. Reinecke, W. Jahn, H.J. Allelein, CFD Simulation of Hydrogen Mixing and Mitigation by means of Passive AutoCatalytic RecombinersŽ, Proc. 14th International Topical Meeting on Nuclear Reactor Thermal Hydraulics (NURETH, September 25011, Toronto, Ontario, CanadaR. Kapulla, S. Kelm, G. Mignot, S. Paranjape, D.Paladino, Experimental and Numerical Results for the Erosion Dynamics of a Vertical HeliumAir Jet interacting with a Helium Rich LayerŽ, Proc. International Congress on Advances in Nuclear Power Plants (ICAPP 2015), Nice, France, May 3S. Kelm, J. Lehmkuhl, W. Jahn, H.J. Allelein, A Comparative Assessment of different Experiments on Buoyancy Driven Mixing Processes by means of CFDŽ, Proc. European Review Meeting on Severe Accident Research (ERMSAR), Marseille, France, March 2426 2015S. Kelm, M. Ritterath, H.M. Prasser, H.J. Allelein, Application of the MiniPanda Test Case Erosion of a Stratiefied Layer by a Vertical Jet for CFD ValidationŽ, Proc. OECD/NEA and IAEA Workshop on Experiments and CFD Codes Application to Nuclear Reactor Safety (CFD4NRSDaejeon, Korea, September 913 2012F.R. Menter, et al. CFD Best Practice Guidelines for CFD Code Validation for Reactor Safety ApplicationsŽ, EUECORA Project, EC Contract No FIKS00154, 2001Casey, M., Wintergerste, T. ERCOFTAC Special Interest group on Quality and Trust in Industrial CFD … Best Practice GuidelinesŽ, ERCOFTAC (2000)Mahaffy, J. et al., Best Practice Guidelines for the use of CFD in Nuclear Reactor Safety ApplicationsŽ, NEA/CSNI/R(2007)5, 2007Verein Deutsche Ingenieure, VDI Waermeatlas, 10th edition, Springer, 2006 784NURETH-16, Chicago, IL, August 30-September