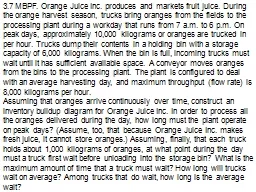
/
3.7 MBPF. Orange Juice Inc. produces and markets fruit juic 3.7 MBPF. Orange Juice Inc. produces and markets fruit juic

3.7 MBPF. Orange Juice Inc. produces and markets fruit juic - PowerPoint Presentation

calandra-battersby
calandra-battersby . @calandra-battersby
Follow
462 views
Uploaded On 2015-09-25

3.7 MBPF. Orange Juice Inc. produces and markets fruit juic - PPT Presentation

Assuming that oranges arrive continuously over time construct an inventory buildup diagram for Orange Juice Inc In order to process all the oranges delivered during the day how long must the plant operate on peak days Assume too that because Orange Juice Inc makes fresh juice it cannot sto ID: 139762

wait 000 inventory truck 000 wait truck inventory plant average trucks long bin oranges hour maximum 6pm rate day

Share:

Link:

Embed:

Download Presentation from below link

Download Presentation The PPT/PDF document "3.7 MBPF. Orange Juice Inc. produces and..." is the property of its rightful owner. Permission is granted to download and print the materials on this web site for personal, non-commercial use only, and to display it on your personal computer provided you do not modify the materials and that you retain all copyright notices contained in the materials. By downloading content from our website, you accept the terms of this agreement.


Presentation Transcript

Slide1

3.7 MBPF. Orange Juice Inc. produces and markets fruit juice. During the orange harvest season, trucks bring oranges from the fields to the processing plant during a workday that runs from 7 a.m. to 6 p.m. On peak days, approximately 10,000 kilograms or oranges are trucked in per hour. Trucks dump their contents in a holding bin with a storage capacity of 6,000 kilograms. When the bin is full, incoming trucks must wait until it has sufficient available space. A conveyor moves oranges from the bins to the processing plant. The plant is configured to deal with an average harvesting day, and maximum throughput (flow rate) is 8,000 kilograms per hour.

Assuming that oranges arrive continuously over time, construct an inventory buildup diagram for Orange Juice Inc. In order to process all the oranges delivered during the day, how long must the plant operate on peak days? (Assume, too, that because Orange Juice Inc. makes fresh juice, it cannot store oranges.) Assuming, finally, that each truck holds about 1,000 kilograms of oranges, at what point during the day must a truck first wait before unloading into the storage bin? What is the maximum amount of time that a truck must wait? How long will trucks wait on average? Among trucks that do wait, how long is the average wait?Slide2

Directions

o) Assume a truck as your flow unit.

a) How long must the plant operate on peak days?

b) At what point during the day must a truck first wait before unloading into the storage bin?

c) What is the maximum amount of time that a truck must wait?

d) Among trucks that wait, how long is the average wait?

e) How long a truck wait on the average?

 Slide3

From 7am-6pm

oranges come in at a rate of 10,000kg/hr

are processed

leave the plant, at 8000kg/hrBecause inflows exceed outflows, inventory will build up at a rate of DR = 10,000-8,000kg/hr = +2,000 kg/hr.Because we cannot have oranges stored overnight, we start with an empty plant so that inventory at 7am is zero: I (7 am) = 0. Because inventory builds up linearly at 2,000kg/hr, the inventory at 6pm is I(6pm) = 2,000 kg/hr * 11 hr = 22,000kg.

3.7 (a)

How long must the plant operate on peak days?Slide4

After 6pm, no more oranges come in

Yet processing continues at 8000 kg/hr until the plant is empty.

Thus, inflows is less than outflows so that inventory is depleted at a rate of

DR = 0 - 8,000 kg/hr = - 8,000 kg/hr.We have I(6pm) = 22,000kgInventory depletes linearly from that level at a rate of -8,000 kg/hr. To empty the plant, 22,000 kg = 8,000 kg/hr Dt or

Dt = 22,000/8,000 hr = 2.75 hr = 2 hr 45min.Thus, the plant must operate until 6pm + 2hr 45min = 8:45pm.

This can all be graphically summarized in the inventory build up diagram shown below.

3.7 (a)

How long must the plant operate on peak days?Slide5

3.7 (a)

Inventory built-up diagram

Bin capacity

6,000 kg

Inventory

I

(

t

)

22,000 kg

6

pm

8:45

pm

7

am

Bin is full:

First truck waits

Last truck leavesSlide6

3.7 (b) and (c)

b) At what point during the day must a truck first wait before unloading into the storage bin?

Inventory builds up in the bins. When the bin is full, then the trucks must wait. This happens at:

2,000 kg/hr Dt = 6,000kg, The first truck will wait after Dt = 6,000/2,000 hr = 3 hr, which is at 10am.c) What is the maximum amount of time that a truck must wait?

The last truck that arrives (at 6pm) joins the longest queue, and thus will wait the longest. It will be able to start dumping its contents in the bins when the bins start depleting. This is at22,000 kg - 8,000 kg/hr

D

t = 6,000.

Dt = (22,000-6,000)/8,000 hr = 2 hr, after 6pm. The maximum truck waiting time is therefore 2 hours, and that is 8pm.

Slide7

Truck Inventory

16

6

pm

8

pm

7

am

10

amSlide8

3.7 (d)

d) Among trucks that wait, how long is the average wait?

Procedure1:

The first truck among those that wait, will wait for 0 hour.The last truck among those that wait, will wait for 2 hours.On average a truck waits for (0+2)/2 = 1 hourProcedure2: The maximum inventory is 22,000. But 6000 of it is in the bin. So the waiting inventory on trucks has a maximum of 22,000 – 6,000 = 16,000Therefore, the average inventory for those trucks that wait is 8,000.

This inventory is depleted at the rate of 8000/hrsI = RT8,000 = 8000T T = 8000/8000 = 1 hourSlide9

3.7 (e)

e) How long a truck wait on the average?

The average wait among trucks that wait is 1 hour. But this is for the last 8 hours of the day.

In the first 3 hours no truck waits. Therefore the average wait is 0 hour.Therefore, the average wait among all trucks is(3×0 + 8×1)/11 = 0.727 hour or 43.6 minutes