/
O RBIS O RBIS

O RBIS - PowerPoint Presentation

calandra-battersby
calandra-battersby . @calandra-battersby
Follow
409 views
Uploaded On 2016-12-17

O RBIS - PPT Presentation

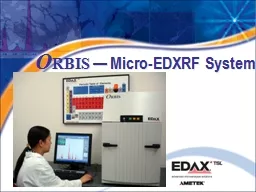
MicroEDXRF System XRF Advantages Nondestructive No beam damage or coating of sample Minimal Sample Preparation conductivity not required sample shape can be irregular Detection limits improve 10x or better vs SEMEDS ID: 502612

image map spectral mapping map image mapping spectral sample ceramic scaling elemental distribution overlay resolution cross metal bone alumina

Share:

Link:

Embed:

Download Presentation from below link

Download Presentation The PPT/PDF document "O RBIS" is the property of its rightful owner. Permission is granted to download and print the materials on this web site for personal, non-commercial use only, and to display it on your personal computer provided you do not modify the materials and that you retain all copyright notices contained in the materials. By downloading content from our website, you accept the terms of this agreement.


Presentation Transcript

Slide1

ORBIS — Micro-EDXRF SystemSlide2

XRF AdvantagesNon-destructive: No beam damage or coating of sampleMinimal Sample Preparation: conductivity not requiredsample shape can be irregular

Detection limits improve: 10x or better (vs. SEM-EDS)

Navigation by Optical Microscope

Low Vacuum (~ 300 mTorr) or No Vacuum (Air)

More appropriate than SEM for larger scale features

X-rays are penetrating (microns to millimeters)Slide3

Sample Chamber / XYZ StageChamber DoorWidth ~ 500 mmHeight ~ 515 mmCan be set up to swing:

Right to left (as shown)

Left to Right

Open access to sample chamberSlide4

Manual Control and AnalysisSlide5

Spectral Mapping: Mapping ExamplesSlide6

Elemental Spatial Distribution Maps: Paper

Mg Map

Al Map

Fe Map

Generation of BMP Elemental Maps

Fe X-rays penetrate paperSlide7

Mapping Metal Analysis: Coins (Non-Destructive)* Rare Coin (2 Reichsmark - 1927?)

*

Pixels: 64 x 50 Map

* Dwell time: 0.3 s/pixel

* Total time ~ 20 minutes

Conclusion:

Counterfeit CoinSlide8

Cl Mapping of Cement Core: Filtered Excitation

Surface Treatment

Cross Section

Cement Core

Goal:

To access diffusion of Cl into cement from deicing agent where Cl could corrode supporting steel

Cores are cross-sectioned

Rough cut

(often there is a desire to avoid polishing to minimize sample preparation or corruption of the sample)

Acquisition of data with Rh-tube, poly-capillary optic and Al(thin) filter to remove interfering scatter from Rh(L) tube lineSlide9

Cement Chemistry – Road Salt: Filtered ExcitationData courtesy of J.M. Davis, Microanalysis Research Group – NISTMap images processed and displayed using Lispix SW

Surface TreatmentSlide10

Spectral Mapping - Bone Fossilization

Fe

Na

K

Si

P

Data courtesy of George Havrilla, LANLSlide11

Map Tool: Substitution Map Image Overlay Fe – Red

K –

Blue

Si –

Yellow

P –

Gray

Na -

Green

Bone FossilizationSlide12

Map Tool: Elemental Image Overlay – RGB Phase AnalysisBone fossilization Ca – RedBone

Si – Green

mineral

P – Blue

Bone

Substitution Overlay Image: Ca-Si-PSlide13

Map Tool: Elemental Image Overlay – RGB Phase Analysis

Bone fossilization

Bone – purple (Ca, P)

New mineral – orange (Ca, Si)Slide14

Spatial Distribution Maps: Facial Tissue Tissue masked with carbon tape for Si-free zone Mapping region 15.6 mm x 11.3 mmSlide15

Map Tool: Data Mining

Recall spectra from mapped pixels

Hot Si spots hide low-level Silicone coverageSlide16

Map Tool: 3-Log Band Image Scaling 3 individual color logarithmic scales (NIST) Low level Silicone distribution exposed in

GreenSlide17

Spectral Mapping with Poly-capillary and Filter – Alumina supported Catalysts Ag supported on Alumina Spheres

Pd supported on Alumina pellets

Objective:

Measure metal distribution in ceramic support

Samples: Embedded in epoxy and cross-sectioned on one side (no polish)

Ag(L), Pd(L) versus Ag(K), Pd(K)

L-lines probe ~ 20

m

m into ceramic; no need to make a thin section

K-lines probe ~ 4 mm into ceramic; interference from opposite surface

Map Acquisition: Rh tube excitation requires filter to remove Rh(L) interference

Poly-capillary: ~ 55 mm FWHM lateral resolution at Ag(L), Pd(L)

Thin Al filter to remove Rh(L) from exciting spectrum

True Analytical flexibility in micro-XRF beamSlide18

Spectral Mapping – Alumina supported Catalysts

Ag(L) Map: Thermal Image Scaling

Pd(L) Map: Thermal Image Scaling

Objective:

Measure metal distribution in ceramic support

Samples: Embedded in epoxy and cross-sectioned on one side (no polish)

Metal is concentrated in the exterior shell of the ceramic supportSlide19

Spectral Mapping – Alumina supported Catalysts

Ag(L) Map: 3 Log Band Image Scaling

Pd(L) Map: 3 Log Band Image Scaling

Objective:

Measure metal distribution in ceramic support

Samples: Embedded in epoxy and cross-sectioned on one side (no polish)

Specialized Image Scaling reveals important distributional details

Ag(L) map shows interior ring of Ag at weaker concentration, but no internal Ag

Pd(L) map shows the interior pellet has weak, uniform concentration of Pd Slide20

High Resolution Spectral Mapping – Odessa Meteorite (20mm x 16 mm)Area ~ 20 mm x 16 mm

RGB Merge

Fe – Red

Ni – Green

P - Blue

Elemental Image Overlay

Total Spectral Count Image

(TSC Image)

Fe – green

Ni – blue

Cr – cyan

S – magenta

Cl – yellow

P - redSlide21

High Resolution Spectral Mapping – Odessa Meteorite (20mm x 16 mm)

Elemental Image Overlay

P

Cl

Fe

S

Ni

FeSlide22

High Resolution Spectral Mapping –

Odessa Meteorite (20mm x 16 mm)

RGB Merge

Fe – Red

Ni – Green

P - Blue

Fe:Ni (Kamacite) Fe:Ni (Taenite) Fe:Ni:P(

*

) (Schreibersite)

*

*

*

*

*

*

*

*

*

*Slide23

High Resolution Spectral Mapping –

Odessa Meteorite (20mm x 16 mm)

RGB Merge

Fe – Red

Ni – Green

S - Blue

Fe:Ni (Kamacite) Fe:Ni (Taenite) FeS (Troilite)

Related Contents


Next Show more