/
RIT-CIMS/USDOT RIT-CIMS/USDOT

RIT-CIMS/USDOT - PowerPoint Presentation

calandra-battersby
calandra-battersby . @calandra-battersby
Follow
375 views
Uploaded On 2016-04-08

RIT-CIMS/USDOT - PPT Presentation

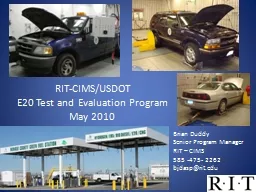
E20 Test and Evaluation Program May 2010 Brian Duddy Senior Program Manager RIT CIMS 585 475 2262 bjdaspritedu 1 Rochester Institute of Technology Center for Integrated Manufacturing Studies CIMS ID: 276646

999 e20 vehicles fuel e20 999 fuel vehicles vehicle emissions rit nov program testing test fleet results cims ppm

Share:

Link:

Embed:

Download Presentation from below link

Download Presentation The PPT/PDF document "RIT-CIMS/USDOT" is the property of its rightful owner. Permission is granted to download and print the materials on this web site for personal, non-commercial use only, and to display it on your personal computer provided you do not modify the materials and that you retain all copyright notices contained in the materials. By downloading content from our website, you accept the terms of this agreement.


Presentation Transcript

Slide1

RIT-CIMS/USDOT

E20 Test and Evaluation Program May 2010

Brian Duddy

Senior Program Manager

RIT – CIMS

585 -475- 2262bjdasp@rit.edu

1Slide2

Rochester Institute of TechnologyCenter for Integrated Manufacturing Studies (CIMS)

E20 Test and Evaluation ProgramProgram Background

Test ObjectivesE20 Study Fleet VehiclesEmissions Testing PlanTest Results to Date

Fleet MonitoringRemaining IssuesSummary

2Slide3

RIT CIMS E20 Program Background

In July 2007 CIMS was asked by US DOT to do a study on 10 vehicles running E20 in support of the “20 in 10” initiative.DOT RITA asked for conventional vehicles, at least 4-7 years old that had not regularly been exposed to E10 ethanol.

We folded this program into an existing research grant for alternative fuels (ethanol, biodiesel & hydrogen).We were already looking at the performance of E85 in Monroe County (NY) flex fuel fleet.

Aug 07 - MC agreed to dedicate a 10 vehicle set to running on E20. (Light duty trucks and sedan.)Sept-Oct 07 – Set up fuel storage, driver cards, vehicle monitoring systems, plan for emissions testing (E0&E20).

Nov-Dec 07 – Emissions on E0 to baseline vehicles.

3Slide4

Monroe County / Rochester, NY Area

Testing in Monroe County offered unique opportunities and conditions

1300 sq. mile region

Four season testingCold weather starts

Hot weather soakDiverse vehicle set

Multiple driversUrban and Rural

4Slide5

Snapshot of Monroe County Vehicle Fleet

Vehicles running on Ethanol

300 Conventional Light Duty Vehicles – E20 fueled

100 Flex Fuel Vehicles (Impalas, Uplanders) (E20 and E85)

100 Sheriff vehicles (Ford Crown Victoria) (E20 and E85)

Other Alternative Energy Vehicles:

300+ Diesel vehicles (B5/B20)25 hybrids (Silverados, Malibus, Escapes)

First-generation battery powered vehicles

Hydrogen Fuel Cell Vehicle

(GM

Project Driveway

)

Green Fueling Station

(B20/E85/E20/Hydrogen/CNG)

5Slide6

RIT CIMS E20 Test Objectives

Impact to public of E20 operation in conventional

vehicles – driveability. (Key DOT Objective)Exhaust emission deltas between E0 and E20.

Impact to vehicle fleets – durability, maintenance.

Impact to fuel economy vs. E0 operation.Life cycle cost of E20 fuel operation.

Report on supply chain issues with ethanol fuel.6Slide7

RIT/MC 10-Vehicle E20 Study Fleet

Monroe County E20 Vehicle Testing List

Model Year

Manfr

Model Type

Date

of Emissions

Test - gasoline

Mileage at test

Current Mileage

1998

Ford

F150 Pickup

3-6 Dec 2007

73860

101763

2000

Chevy

Impala Sedan

6-8 Nov 2007

83030

99008

2001

Ford

F250 Pickup 4x4

11-14 Nov 2007

54499

68320

2001

Ford

F250 Pickup 4x46-8 Nov 20071076111496642001ChevySilverado Pickup 4x427-30 Nov 20071197761544392001ChevySuburban/Blazer 4x427-30 Nov 200748787663382002ChevyG3500 Van11-14 Nov 2007827941033042002FordF250 Pickup 4x411-13 Dec 20071208181345512002GMCSierra Pickup 4x427-30 Nov 200751123704772004FordF250 Pickup 4x21-3 Nov 20072973861923

7Slide8

RIT E20 Emissions Testing Plan

Tailpipe Emissions from 10 vehicle test group

Baseline UnleadedNov-Dec 2007

E20 “Deltas”Jun-Jul 2008

E20 Mid-TermAug-Nov 2009Back-To-Back

5 Gases(NOx, THC, NMHC, CO, CO2)5 Gases5 Gases & Ethanol in exhaust stream* for NMOG calculations

Fuel Economy (F.E.)E0 Road Fuel

F.E.

w/

E20

Road Fuel

F.E. deltas

with controlled fuels

* With support from NREL

All testing done at Delphi Technical Center, Rochester NY

8Slide9

Emissions Testing Program

Emissions evaluation performed at Delphi Technical Center Rochester world-class facilities.Criteria pollutants measured during FTP75 evaluation.

Three runs on each fuel – if any anomalies, test was rerun to get three good samples.Horiba OPE series emissions analyzer.

Nov 2009 testing included measuring tailpipe ethanol emissions with equipment provided by NREL.

Real world work vehicles in a high precision testing facility.

9Slide10

Delphi Vehicle Emissions Lab - Rochester

10Slide11

1.999

1.999

1.999

1.999

1.999

1.999

1.999

1.999

1.999

1.999

Delphi TCR Vehicle Emission Lab (VEL2)

Bag Bench

Tailpipe Bench

Engine Bench

Sample

Conditioning

Unit

Constant Volume Sampler

Critical Flow Venturi

Sample

Bags

8.5” Twin Roll Chassis Dynamometer

Cooling Fan

Driver’s

Trace

Robertson, 10/96

Combustion Analysis System

BCO(L) 0-100 PPM - 1500 PPM

BCO2 0-1.5% - 3.00%

BHC 0 - 25 PPM - 100 PPM

BNOx 0 - 25 PPM - 150 PPM

BCH4 0 - 25 PPM

Temperature control: 72° ± 2°F

Humidity control: 50 ± 2 grain

1.999

1.999

1.999

1.999

1.999

1.999

1.999

1.999

1.999

1.999

1.999

1.999

1.999

1.999

1.999

Bag Bench

Tailpipe Bench

Engine Bench

Horriba

System

11Slide12

RIT E20 Program Timeline

July 2007

DOT Request

Aug 2007

10 Vehicles Identified

Nov 2007E0 Emissions

Aug 2009E0-E20 EmissionsMPG/Alcohol

Jun 2008

E20 Emissions

Feb 2008

10 Veh on E20

Dec 2008

All MC conventional veh on E20

Dec 2009

Paper Pub

Sept 2008

EPA Waiver for Full Test Program

2008

2009

2010

2007

Oct 2008

Driver Interviews

Nov 2010

DOT

Program

Concludes

12Slide13

Emissions Test Results

Current Back-to-Back data shows significant improvement in HC and CO and neutral on CO

2

.Historic trend indicates some degradation in emissions (expected).

13Slide14

Emissions Test Results

All the measurements for both fuels were well below the EPA limit for Criteria Pollutants

Cold (20°F) start testing vs. ambient indicates degradation in HC and CO, however, less for E20 than E0.

14Slide15

E0-E20 Fuel Economy Results

MC vehicle data was sorted for dedicated fuel use, 1 year of data per fuel, minimum of 20 data points per fuel, same organization for both fuels. Practical (On-road)5.93% average measured reduction in 47 fleet vehicles.Theoretical (Fuel Energy)

6.85% calculated reduction based on fuel energy.Experimental (Delphi)Roughly 6.5% reduction based on measured carbon emissions during chassis dynamometer FTP testing.Results are consistent with expectations for energy content of E20 fuel.

15Slide16

E20 Fuel Economy Results

Fuel economy was determined through on-road data and experimentally.

Odometer and fuel volume collected through MC PetroVend fuel control system.

Data ported to RIT database for analysis.

General observations: on-road fuel economy can be greatly impacted by:

Seasonal variationUsage: organization / mission / driver

16Slide17

E20 Drivability Results

Driver SurveysMC Drivers filled out fueling and performance cards for one calendar yearAdditionally took end-of-year survey

No driving issuesPositive commentsHigh Mileage vehicle has

32,000 miles on E20

17Slide18

Use of Networkcar Vehicle Monitoring System

All 10 study vehicles and a number of other E20 vehicles are equipped with the commercial Networkcar monitoring system linked into the OBD network.System provides GPS location, speed ranges, idle time and alerts when vehicle detects a fault or failure.

18Slide19

E20 Fleet Tracking

All data on MC and RIT vehicles is imported into RIT proprietary database for all vehicles.

630 Vehicles; 88,647 Fueling Entries; 15,552 Maintenance Entries.

Maintenance, fuel use, and TCO can be calculated per fuel.

Looking for critical system failures MTBCF

Analysis of full E20 TCO is in progress.

19Slide20

The RIT program features a unique public-private partnership between the University, MC and Delphi.

The RIT project has by far the largest and most comprehensive E20 fleet study: vehicle types and ages, weather, # of drivers.10 Study vehicles have driven over 200K miles on E20; fleet has consumed over 300K gallons of E20 and driven well

over 4 million miles so far…The results of the E20 program will be folded in to our overall assessment of the “Technology Readiness” of alternative fuels.

E20 and E85 are being evaluated along with biodiesel and hydrogen ICE.

RIT Research Highlights

20Slide21

Issues with remaining testing

Our DOT research grant finishes in Nov 2010.Not addressed in any of the studies: Impact of ethanol on “aftermarket” parts.Industry and

Gov’t still must evaluate motorcycle/recreational vehicle fleets.The County wishes to continue using E20 in their vehicles, but our testing waiver will expire with our DOT program.

We likely won’t get to see E20 over the “full useful life” of many vehicles before Nov.

21Slide22

Summary

RIT-CIMS was able to execute an effective E20 Test and Evaluation on an aggressive timeline.Neither CIMS nor Monroe County has uncovered any adverse effects of E20 on their vehicle fleet.Fuel mileage is impacted, but results are as expected.Tailpipe emissions are either a “wash” or in some cases, significantly lower.

Drivers and fleet managers are happy with E20.Total ownership cost is TBD - will depend on supply chain, subsidies, tax credits, etc. (Is E10 cheaper than E0?)

22Slide23

Questions?

Brian DuddySenior Program Manager

RIT – CIMSRochester NY585 -475- 2262

bjdasp@rit.edu

23