PPT-Source: Source: UN Women's calculations using data from Dem
Author : calandra-battersby | Published Date : 2015-10-16
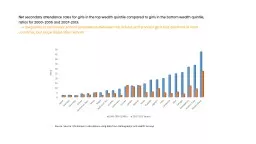
Source Source UN Womens calculations using data from Demographic and Health Surveys Globally womens labour force participation rates have stagnated albeit with significant
Presentation Embed Code
Download Presentation
Download Presentation The PPT/PDF document "Source: Source: UN Women's calculations ..." is the property of its rightful owner. Permission is granted to download and print the materials on this website for personal, non-commercial use only, and to display it on your personal computer provided you do not modify the materials and that you retain all copyright notices contained in the materials. By downloading content from our website, you accept the terms of this agreement.
Source: Source: UN Women's calculations using data from Dem: Transcript
Download Rules Of Document
"Source: Source: UN Women's calculations using data from Dem"The content belongs to its owner. You may download and print it for personal use, without modification, and keep all copyright notices. By downloading, you agree to these terms.
Related Documents