/
Active Living Research Active Living Research

Active Living Research - PDF document

celsa-spraggs
celsa-spraggs . @celsa-spraggs
Follow
391 views
Uploaded On 2016-05-14

Active Living Research - PPT Presentation

Building Evidence to Prevent Childhood Obesity and Support Active Communities wwwactivelivingresearchorg
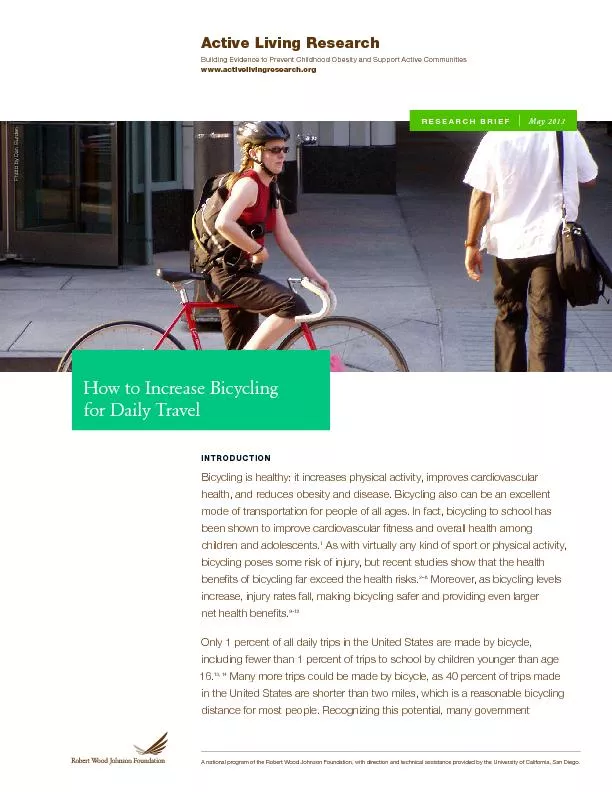
 INTRODUCTION health and reduces obesity and disease Bicycling also can be an excellent bee ID: 319401

Building Evidence Prevent Childhood

Share:

Link:

Embed:

Download Presentation from below link

Download Pdf The PPT/PDF document "Active Living Research" is the property of its rightful owner. Permission is granted to download and print the materials on this web site for personal, non-commercial use only, and to display it on your personal computer provided you do not modify the materials and that you retain all copyright notices contained in the materials. By downloading content from our website, you accept the terms of this agreement.


Presentation Transcript

Active Living Research Building Evidence to Prevent Childhood Obesity and Support Active Communities www.activelivingresearch.org INTRODUCTION health, and reduces obesity and disease. Bicycling also can be an excellent been shown to improve cardiovascular fitness and overall health among children and adolescents. 1 As with virtually any kind of sport or physical activity, benefits of bicycling far exceed the health risks. 2–8 Moreover, as bicycling levels net health benefits. 9-12 Only 1 percent of all daily trips in the United States are made by bicycle, 16. 13, 14 Many more trips could be made by bicycle, as 40 percent of trips made in the United States are shorter than two miles, which is a reasonable bicycling distance for most people. Recognizing this potential, many government RESEARCH BRIEF | May 2013 A national program of the Robert Wood Johnson Foundation, with direction and technical assistance provided by the University of California, San Diego. for Daily Travel Nathan McNeil Photo by Dan Burden Active Living Research | RESEARCH BRIEF | May 2013 page agencies and public health organizations have advocated for increasing bicycling as a way to improve people’s health and reduce air pollution, carbon emissions, congestion, noise, traffic dangers, and other harmful effects of car use. 15–20 But what are the most effective strategies cities can use to increase bicycling? A growing number of studies have assessed the effectiveness of many strategies for increasing levels of bicycling, including on-street bike lanes, off-street bike paths, and other bicycling infrastructure; promotional and educational programs, such as bike-to-work days and bicycle training classes; and policies, including parking restrictions and traffic-calmed neighborhoods. This brief summarizes the available evidence about strategies for increasing bicycling levels and encouraging bicycling as a mode of transportation. It also presents related policy implications. Key Research Results At the city level, bicycling infrastructure is strongly associated with overall levels of bicycling, especially with bicycling to work, school, or shopping. 21–24 One study of 35 large U.S. cities found that each additional mile of bike lane per square mile was associated with about a 1 percent increase in the share of workers commuting by bicycle. 21 A more recent study using data from 90 large U.S. cities found that cities with 10 percent more bike lanes or paths had about 2 percent to 3 percent more daily bicycle commuters. 25 It is less clear what type of infrastructure is most effective at increasing bicycling for daily travel. 26 Simply living close to bike lanes or paths does not necessarily increase levels of bicycling. 27–30 However, a Seattle study found that adults living within a half-mile of a bike path were 20 percent more likely to bicycle at least once a week. 29 Photo by Jennifer Dill Active Living Research | RESEARCH BRIEF | May 2013 page Creating bicycle boulevards by adding traffic calming features, such as speed humps, curb extensions, and pedestrian crossways, on streets with a low volume of traffic and installing cycle tracks, which are on-street bike lanes that are physically separated from motor vehicle lanes, encourages bicycling on streets where they are installed. Studies in Copenhagen, 31 London, 32 Washington, D.C., 33 and Montreal 34 found that bicycling increased after cycle tracks were installed and that cycle tracks attract more bicyclists than similar streets without cycle tracks. Although the studies did not examine whether bicycling increased overall or simply shifted from other streets to those with cycle tracks, the results confirm the popularity of cycle tracks. A Portland study found that cyclists went the furthest out of their way to use off-street bike paths, followed by bicycle boulevards, suggesting a general preference for facilities protected from motor vehicle traffic. Striped bike lanes (i.e., those without physical separation) helped offset the unsafe, uncomfortable feeling of bicycling on busy arterial roads, but were not preferred over residential streets that had a low volume of traffic and no lanes. 35 New forms of pavement markings, including bike boxes (see photo), shared lane markings or sharrows, and colored bike lanes, increase perceptions of safety, help guide bicyclists and motorists, and provide official, visible recognition that bicyclists are legitimate users of the road. 36–40 The impact of such markings on levels of bicycling has not been determined. Photo by Nathan McNeil Other features of bicycle infrastructure also make a difference. Bicycling declines with the number of stops (e.g., due to stop signs or signals) along a route, 41 poor pavement quality 23, 32, 42 and inadequate bike parking. 43 Several studies have found that women prefer facilities that have less motor vehicle traffic or are separated from traffic. 45–48 One study also found that women felt less comfortable than men on off-street paths, perhaps because of personal security concerns, such as fear of assault in isolated areas. 45 Active Living Research | RESEARCH BRIEF | May 2013 page Marketing and educational programs, as well as regulations, also can affect levels of bicycling. Programs that promote bicycling may help increase the effectiveness of investments in bicycle facilities. 49–52 Studies have reported long-term increases in bicycling following bike-to-work days, 53,54 “ciclovias,” and similar events that close streets to cars for the enjoyment of cyclists, pedestrians, and others. 55, 56 One study of the impact of Safe Routes to School programs found an increase in bicycling, 57 but a second study found no effect. 58 Cities that have implemented bicycle sharing programs report substantial increases in bicycling. 59 For example, the proportion of trips made by bicycle increased from 1 percent to 2.5 percent in Paris 60, 61 and from 0.75 percent to 1.76 percent in Barcelona. 62 In London, the OYBike bike share program has encouraged bicycling as a mode of transportation—6 percent of users reported shifting from driving and 34 percent reported shifting from transit. Another 23 percent reported that without the bike share program, they would not have traveled at all. 63 Helmets can help prevent head injuries in falls and crashes, 64 but laws requiring helmet use have been shown to reduce bicycling among adults in Canada and Australia. 65–67 Lower speed limits for vehicles make bicycling safer and more attractive. One study conducted in Germany found that reducing general speed limits led to a significant increase in bicycling. 68 A comprehensive package of infrastructure, programs, and policies is likely to have the greatest effect. 69 Countries and cities with high levels of bicycling have extensive infrastructure, as well as pro- bicycle policies and programs, whereas those with low levels of bicycling have done much less. 70-72 Some cities, even very large cities, have dramatically raised bicycling levels but only with a multifaceted, coordinated approach that involved careful planning and ongoing input from residents. Figure 1 shows the increase in bicycling rates for 14 cities that implemented a wide range of measures to increase bicycling. The rates reflect bicycling for all purposes or only for commuting, depending on the data source. 73 Because cities have implemented a wide range of measures at the same time, sometimes over many years or decades, it is difficult to isolate the separate impact of individual measures on bicycling levels. Bike sharing programs in Paris (Velib’) and Barcelona (Bicing) have unquestionably increased cycling, 59 but several other efforts occurred at the same time, including expansion of the bikeway system and bike parking, bicycling education, and traffic calming. The daily fee charged to cars for accessing central London, which is a 21-sq.km zone, has been widely credited for increased bicycling there, but it is only one of many programs that have encouraged more bicycling since 2000. Active Living Research | RESEARCH BRIEF | May 2013 page FIGURE 1. Increase in Bicycling for Transportation in 14 Cities with Comprehensive EffortsPercentage of trips by bicycleLondon (2003–2006)Barcelona (2005–2007)Paris (2001–2007)Bogotá (1995–2007)Minneapolis (1980–2008)Portland (1990–2008)Berlin (1990–2006)Boulder (1990–2006)Odense (1994–2002)Freiburg (1982–2007)Muenster (1982–2001)Amsterdam (1970–2005)Copenhagen (1998–2005)Groningen (1990–2005) 15 Integrating bicycling with public transportation increases the viability of each. Bicycling can expand the service areas of rail transit stations and bus stops. Trains and buses, in turn, can transport bicyclists over much longer distances than would be feasible by bicycle alone. Studies show that bike racks on buses and good bike parking at rail stations increase both bicycling and transit use. 44 In contrast to North American cities, European cities have implemented many deterrents to driving along with efforts to increase bicycling. 69–72 In northern Europe, the much higher cost of owning, using, and parking a car, combined with car-free zones, comprehensive traffic calming, more compact land use, lower overall speed limits, and the limited availability of parking for cars, reduce the convenience and attractiveness of car use. 78,79 Cities such as Berlin have installed traffic calming features on many of their streets, thus discouraging and slowing down driving. While it is likely that policies that deter driving also serve to encourage bicycling, their impact on bicycling has not been directly tested. Active Living Research | RESEARCH BRIEF | May 2013 page Conclusion Research shows that infrastructure, programs, and policies that support bicycling can significantly increase levels of bicycling for daily travel. However, it is difficult to generalize about the effectiveness of specific strategies or particular kinds of bicycle infrastructure. Many studies only measure the impact of incremental expansions and do not capture the full impact of a completed bicycle system. Indeed, the most compelling evidence comes from communities that have implemented a fully integrated package of strategies to increase bicycling. The evidence reviewed in this brief suggests that a comprehensive approach produces a much greater impact on bicycling than individual measures that are not coordinated. POLICY IMPLICATIONS To maximize bicycling opportunities, cities must build a network of safe and comfortable routes using a mix of bike lanes, bike boulevards, cycle tracks, and bike paths that connect residents to potential destinations. 26 Infrastructure that maximizes the separation between bicyclists and motor vehicles, without making bicyclists travel too far out of their way, may be more effective for encouraging new bicyclists than on-street pavement markings. Investments in infrastructure should be supported by promotional programs, such as bike- to-work days and bicycle training, Safe Routes to School programs, and other programs that facilitate bicycling, including bike sharing systems and those that accommodate bicycles on buses and trains. Policies that make driving more expensive (e.g. higher gasoline taxes and parking fees) and less convenient (e.g. reduced parking supply and reduced speeds) may be necessary to maximize the effectiveness of infrastructure investments in encouraging bicycling. To encourage bicycling as a mode of transportation, communities also must implement land use and development policies to help ensure that destinations for daily needs, such as school, work, and shopping, are within convenient bicycling distance from home. 77 This brief was prepared by Jennifer Dill, PhD, Nohad A. Toulan School of Urban Studies and Planning, Portland State University; Susan L. Handy, PhD, Department of Environmental Science and Policy, University of California at Davis; and John Pucher, PhD, Edward J. Bloustein School of Planning and Public Policy, Rutgers University, with support from the Active Living Research staff. Peer review was provided by David R. Bassett, Jr., PhD, The University of Tennessee, Knoxville and Daniel A. Rodriguez, PhD, The University of North Carolina, Chapel Hill. For updates and a Web-based version of this brief, visit www.activelivingresearch.org . Active Living Research , a national program of the Robert Wood Johnson Foundation, stimulates and supports research to identify environmental factors and policies that influence physical activity for children and families to inform effective childhood obesity prevention strategies, particularly in low-income and racialethnic communities at highest risk. Active Living Research wants solid research to be part of the public debate about active living. Active Living Research University of California, San Diego 3900 Fifth Avenue, Suite 310 San Diego, CA 92103-3138 www.activelivingresearch.org Active Living Research | RESEARCH BRIEF | May 2013 page Endnotes Cooper, AR, Wedderkopp, N, Wang, H, Andersen, LB, Froberg, K, Page, AS. 20006. Active travel to school and cardiovascular fitness in Danish children and adolescents. Medicine & Science in Sports & Exercise. 38(10), 1724-1731. 2 Anderson, L., Schnor, P., Schroll, M., and Hein, H., 2000. All-cause mortality associated with physical activity during leisure time, work, sports, and cycling to work. Arch Intern Med. 160, 1621-1628. 3 Bassett, D., Pucher, J., Buehler, R., Thompson, D., Crouter, S., 2008. Walking, cycling, and obesity rates in Europe, North America, and Australia. J Phys Act Health. 5, 795-814. 4 Gordon-Larsen, P., Boone-Heinonen, J., Sidney, S., Sternfeld, B., Jacobs, D., Lewis, C., 2009. Active commuting and cardiovascular disease risk: the CARDIA study. Arch Intern Med. 169(13), 1216-1223. 5 Hamer, M., Chida, Y., 2008. Active commuting and cardiovascular risk: A meta-analytic review. Prev Med. 46(1), 9-13. 6 Huy, C., Becker, S., Gomolinsky, U., Klein, T., Thiel, A., 2008. Health, medical risk factors, and bicycle use in everyday life in the over-50 population. J Aging Phys Act. 16(4), 454-464. 7 Shephard, R., 2008. Is active commuting the answer to population health? Sports Med. 39(9), 751-758. 8 Garrard, J, Rissel, C, Bauman, A. 2012. Health benefits of cycling. In Pucher J, Buehler R. eds. 2012. City Cycling . MIT Press, Cambridge, Mass, pp. 31-54. 9 Elvik, R., 2009. The non-linearity of risk and the promotion of environmentally sustainable transport. Accid Anal Prev. 41, 849-855. 10 Jacobsen, P., 2003. Safety in numbers: more walkers and bicyclists, safer walking and bicycling. Inj Prev. 9, 205-209. 11 Robinson, D., 2005. Safety in numbers in Australia: More walkers and bicyclists, safer walking and cycling. Health Promot J Austr. 16, 47-51. 12 Jacobsen, P, Rutter, H. 2012. Cycling safety. In Pucher, J, Buehler, R. eds. 2012. City Cycling . MIT Press, Cambridge, Mass, pp. 141-156. 13 Pucher J, Buehler R, Seinen M. Bicycling renaissance in North America? An update and re-appraisal of cycling trends and policies. Transportation Research Part A-Policy and Practice. 2011: 45(6): 451-475. 14 U.S. Department of Transportation, Federal Highway Administration, 2009 National Household Travel Survey. http://nhts.ornl.gov . Accessed August 20, 2012. 15 BMA, 1992. Cycling: Towards health and safety. Oxford University Press, Oxford. 16 Cavill, N., Kahlmeier, S., and Racioppi, F., Eds., 2006. Physical activity and health in Europe: Evidence for action. WHO Regional Office for Europe, Copenhagen. 17 OECD, 2004. National policies to promote cycling. Organisation for Economic Cooperation and Development, European Conference of the Ministers of Transport, Paris, France. 18 USDHHS, 2008. Physical activity guidelines for Americans. U.S. Department of Health and Human Services, Washington, DC. 19 USDOT, 2004. National Bicycling and Walking Study: Ten Year Status Report. U.S. Department of Transportation, Federal Highway Administration, Washington, DC. 20 WHO, 2002b. Physical activity through transport as part of daily activities. WHO Regional Office for Europe, Copenhagen. 21 Dill, J., Carr, T., 2003. Bicycle commuting and facilities in major U.S. cities: If you build them, commuters will use them. Transp Res Rec. 1828, 116-123. 22 Nelson, A.C., Allen, D., 1997. If you build them, commuters will use them. Transp Res Rec. 1578, 79-83. 23 Parkin, J., Wardman, M., Page, M., 2008. Estimation of the determinants of bicycle mode share for the journey to work using census data. Transportation. 35, 93-109. 24 Pucher, J., Buehler, R., 2006. Why Canadians cycle more than Americans: A comparative analysis of cycling trends and policies. Transport Policy 13 (3): 265-279. 25 Buehler R, Pucher J. Cycling to work in 90 large American cities: new evidence on the role of bike paths and lanes. Transportation. 2012; 39(2): 409-432. 26 Furth, P. 2012. Bicycling infrastructure for mass bicycling: A transatlantic comparison. In Pucher J, Buehler R. 2012. City Cycling . MIT Press, Cambridge, Mass, pp. 105-139 27 Dill, J., Voros, K., 2007. Factors affecting bicycling demand: Initial survey findings from the Portland, Oregon, Region. Transp Res Rec. 2031, 9-17. 28 Akar G, Clifton KJ. The influence of individual perceptions and bicycle infrastructure on the decision to bike. Transp Res Rec. 2009, 2140: 165-172. 29 Vernez-Moudon, A.V., Lee, C., Cheadle, A.D., et al., 2005. Cycling and the built environment, a US perspective. Transportation Research Part D. 10, 245-261. 30 Krizek, K.J., Johnson, P.J., 2006. Proximity to trails and retail: Effects on urban cycling and walking. J Am Plann Assoc. 72, 33-42. 31 Jensen, S.U., 2008a. Bicycle tracks and lanes: A before-after study. 87th Annual Meeting of the Transportation Research Board. Transportation Research Board, Washington, DC. 32 Transport for London, 2004a. Business case for cycling in London (Draft). Transport for London Street Management, London. Accessible at: www.tfl.gov.uk/assets/downloads/businessandpartners/business-case- for-cycling.pdf . 33 Kittelson & Associates, Inc, Portland State University, Toole Design Group. Bicycle Facility Evaluation Washington, DC. Executive Summary. District Department of Transportation, April 2012. http://dc.gov/DC/ DDOT/Publication%20Files/On%20Your%20Street/Bicycles%20and%20 Pedestrians/Bicycles/Bike%20Lanes/DDOT_BicycleFacilityEvaluation_ ExecSummary.pdf Active Living Research | RESEARCH BRIEF | May 2013 page 34 Lusk, A. C., P. G. Furth, P. Morency, L. F. Miranda-Moreno, W. C. Willett, and J. T. Dennerlein. 2011. Risk of Injury for Bicycling on Cycle Tracks versus in the Street. Injury Prevention 17: 131–135. 35 Broach J, Dill J, Gliebe J. Where do cyclists ride? A route choice model developed with revealed preference GPS data. Transportation Research Part A 46 (2012) 1730-1740. Accessible at: http://dx.doi.org/10.1016/j. tra.2012.07.005 . 36 Dill J, Monsere CM, McNeil N. Evaluation of bike boxes at signalized intersections. Accident Analysis and Prevention. 2012: 44(1): 126-134. 37 Newman, A., 2002. The marking of advanced cycle lanes and advanced stop boxes at signalised intersections. City Streets Unit, Christchurch City Council, Christchurch, New Zealand. 38 Rodgers, A, 2005. A23 & A202 ASL Before and After Study. Transport for London, London. Accessible at: www.tfl.gov.uk/assets/downloads/ businessandpartners/A23-and-A202.pdf . 39 Wall, G., Davies, D., Crabtree, M., 2003. Capacity implications of Advanced Stop Lines for cyclists. Transportation Research Laboratory, London. 40 Hunter, W., Thomas, L., Srinivasan, R., Martell, C., 2010. Evaluation of Shared Lane Markings. Federal Highway Administration, Washington, DC.,FHWA-HRT-10-041. Accessible at: www.fhwa.dot.gov/publications/ research/safety/pedbike/10041/10041.pdf 41 Rietveld, P., Daniel, V., 2004. Determinants of bicycle use: do municipal policies matter? Transportation Research Part A. 38, 531–550. 42 Antonakos, C., 1994. Enviromental and travel preferences of cyclists. Transp Res Rec. 1438, 25-33. 43 Wardman, M., Tight, M., Page, M., 2007. Factors influencing the propensity to cycle to work. Transportation Research Part A. 41, 339-350. 44 Pucher, J, Buehler, R. 2012. Integration of cycling with public transportation. In Pucher. J, Buehler, R, eds. City Cycling , MIT Press, Cambridge, Mass., pp. 157-181. 45 Emond, C.R., Tang, W., Handy, S.L., 2009. Explaining gender difference in bicycling behavior. Transp Res Rec. 2125: 16-25. 46 Garrard, J., Rose, G., Lo, S.K., 2008. Promoting transportation cycling for women: The role of bicycle infrastructure. Prev Med. 46, 55-59. 47 Garrard, J, Handy, S, Dill, J. 2012. Women and cycling. In Pucher, J, Buehler, R., Eds. 2012. City Cycling , MIT Press, Cambridge, Mass, pp. 211-234. 48 Dill, J., Gliebe, J., 2008. Understanding and measuring bicycling behavior: A focus on travel time and route choice. Oregon Transportation Research and Education Consortium, Portland, OR. 49 Australian Greenhouse Office, 2005. Evaluation of Austalian TravelSmart Projects in the ACT, South Australia, Queensland, Victoria and Western Australia: 2001-2005. Department of the Environment and Heritage. 50 Brog, W., Barta, F., 2007. National demonstration project (FTA): Individualized marketing demonstration program. 86th Annual Meeting of the Transportation Research Board. Transportation Research Board, Washington, DC. 51 Cooper, C., 2007. Successfully changing individual travel behavior: Applying community-based social marketing to travel choice. 86th Annual Meeting of the Transportation Research Board. Transportation Research Board, Washington, DC. 52 City of Portland Office of Transportation, 2006. SmartTrips Northeast Hub comprehensive evaluation report. City of Portland, Portland, OR. 53 League of American Bicyclists, 2008. Bike to Work events in selected US Cities. League of American Bicyclists, Washington, DC. 54 Rose, G., Marfurt, H., 2007. Travel behaviour change impacts of a major ride to work day event. Transportation Research Part A. 41, 351–364. 55 Sarmiento, O., Torres, A., Jacoby, E., Pratt, M., Schmid, T., Stierling, G. The Ciclovía-Recreativa: A mass recreational program with looming public health potential. J Phys Act Health. July 2010, 7: S163-180 56 Gomez, L., Sarmiento, O., Lucimi, D., Espinosa, G., Forero, R., Bauman, A., 2005. Prevalence and factors associated with walking and bicycling for transport among young adults in two low-income localities of Bogotá, Colombia. J Phys Act Health. 2, 445-449. 57 Staunton, C.E., Hubsmith, D., Kallins, W., 2003. Promoting safe walking and biking to school: The Marin County success story. Am J Public Health. 93, 1431-1434. 58 Boarnet, M.G., Day, K., Anderson, C., McMillan, T., Alfonzo, M., 2005. California’s safe routes to school program. Impacts on walking, bicycling, and pedestrian safety. J Am Plann Assoc. 71, 301-317. 59 Shaheen, S, Guzman, S, Zhang, H. 2012. Bikesharing across the globe. In Pucher J, Buehler R. eds. 2012. City Cycling . MIT Press, Cambridge, Mass, pp. 183-209. 60 Nadal, L., 2007. Bike sharing sweeps Paris off its feet. Sustainable Transport. 19, 8-12. 61 City of Paris, 2007. Le bilan des deplacements en 2007 a Paris. La Mairie de Paris, L’Observatoire de Deplacements, Paris, France. 62 Romero, C., 2008. Spicycles in Barcelona. PowerPoint Presentation by City of Barcelona at the Spicycles Conference, Bucharest, Romania, December 2008. Accessible at: http://spicycles.velo.info/Portals/0/ FinalReports/Barcelona_Final_Report.ppt . 63 Noland, R.B., Ishaque, M.M., 2006. Smart bicycles in an urban area: Evaluation of a pilot scheme in London. Journal of Public Transportation. 9(5), 71-95. 64 Thompson, D., Rivara, F., Thompson, R., 2009. Helmets for preventing head and facial injuries in bicyclists (Review). Cochrane Database of Systematic Reviews 1999 (4). Accessible at: www.thecochranelibrary. com/userfiles/ccoch/file/Safety_on_the_road/CD001855.pdf 65 Clarke, C., 2006. The case against bicycle helmets and legislation. World Transport Policy and Practice. 12(2), 6-16. 66 Robinson, D.L., 2006. No clear evidence from countries that have enforced the wearing of helmets. BMJ. 332, 722-725. doi:10.1136/ bmj.332.7543.722-a. Active Living Research | RESEARCH BRIEF | May 2013 page 67 Jacobsen, P., Rutter, H. 2012. Cycling safety. In Pucher, J, Buehler, R. eds. 2012. City Cycling . MIT Press, Cambridge, Mass, pp. 141-156. 68 Bauman, A., Rissel, C., Garrard, J., Kerr, I., Spiedel, R., Fishman, E. 2008. Getting Australia moving: Barriers, facilitators and interventions to get more Australians physically active through cycling. Funded by the Australian Government, Department of Health and Ageing. Cycling Promotion Fund, Melbourne. 69 Pucher, J, Buehler, R. 2012. Promoting cycling for daily travel: Conclusions and lessons from across the globe. In Pucher, J, Buehler, R. 2012. Eds. City Cycling . MIT Press, Cambridge, Mass, pp. 347-363. 70 Pucher, J., Dijkstra, L., 2003. Promoting safe walking and cycling to improve public health: Lessons from the Netherlands and Germany. Am J Public Health, 93(9), 1509-1516. 71 Fietsberaad, 2006. Continuous and integral: The cycling policies of Groningen and other European cycling cities. Amsterdam: Fietsberaad. Accessible at: www.fietsberaad.nl/library/repository/bestanden/ Publication%207%20Continuous%20and%20integral.pdf . 72 Pucher, J., Buehler, R., 2008. Making cycling irresistible: Lessons from the Netherlands, Denmark, and Germany. Transport Reviews. 28(4), 495-528. 73 Pucher J, Dill J, Handy S. Infrastructure, programs, and policies to increase bicycling: an international review. Preventive Medicine. 2010; 50 Suppl 1:S106-125. 74 Buehler, R, Pucher, J. 2012. International Overview: Cycling Trends in Western Europe, North America, and Australia. In Pucher, J, Buehler, R, eds. 2012. City Cycling , MIT Press, Cambridge, Mass, pp. 9-29. 75 Handy, S, Heinen, E, Krizek, K. 2012. Cycling in Small Cities. In Pucher, J, Buehler, R. eds. 2012. City Cycling . MIT Press, Cambridge, Mass, pp. 257-286. 76 Buehler, R, Pucher, J. 2012. Big City Cycling in Europe, North America, and Australia. In Pucher, J, Buehler, R. eds. 2012. City Cycling . MIT Press, Cambridge, Mass., pp. 287-318. 77 Pucher, J, Lanversin, E, Suzuki, T, Whitelegg, J. 2012. Cycling in megacities: London, Paris, New York, and Tokyo. In Pucher, J, Buehler, R. eds. 2012. City Cycling . MIT Press, Cambridge, Mass, pp. 319-345. 78 Pucher, J., Buehler, R., 2008. Making cycling irresistible: Lessons from the Netherlands, Denmark, and Germany. Transport Reviews. 28(4), 495-528. 79 Schmidt, S., Buehler, R., 2007. The planning process in the US and Germany: A comparative analysis. International Planning Studies. 12, 55-75. A national program of the Robert Wood Johnson Foundation, with direction and technical assistance provided by the University of California, San Diego. activelivingresearch.org