/
Cultural Insights Cultural Insights

Cultural Insights - PDF document

celsa-spraggs
celsa-spraggs . @celsa-spraggs
Follow
389 views
Uploaded On 2016-06-20

Cultural Insights - PPT Presentation

Communicating with HispanicsLatinos 
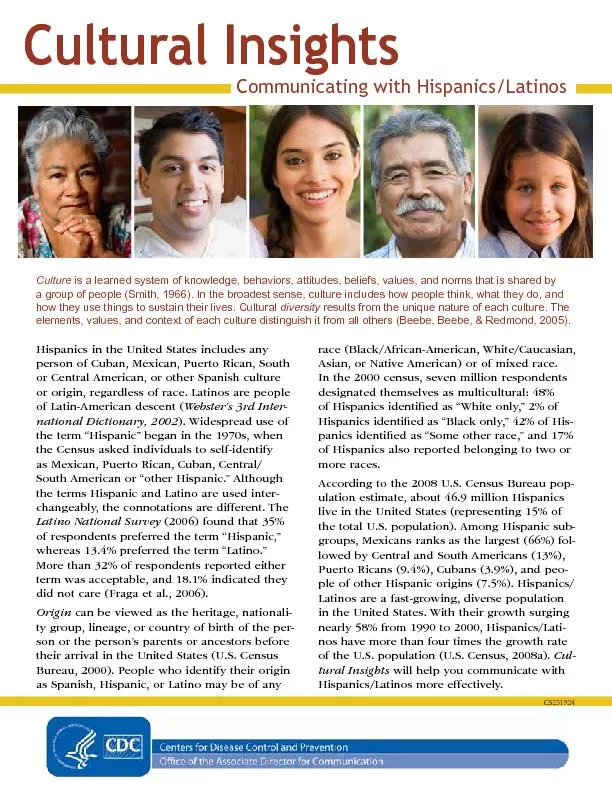
Culture results from the unique nature of each culture The Hispanics in the United States includes any person of Cuban Mexican Puerto Rican South or Central A ID: 369809

Communicating with Hispanics/Latinos Culture results from

Share:

Link:

Embed:

Download Presentation from below link

Download Pdf The PPT/PDF document "Cultural Insights" is the property of its rightful owner. Permission is granted to download and print the materials on this web site for personal, non-commercial use only, and to display it on your personal computer provided you do not modify the materials and that you retain all copyright notices contained in the materials. By downloading content from our website, you accept the terms of this agreement.


Presentation Transcript

Cultural Insights Communicating with Hispanics/Latinos Culture results from the unique nature of each culture. The Hispanics in the United States includes any person of Cuban, Mexican, Puerto Rican, South or Central American, or other Spanish culture or origin, regardless of race. Latinos are people Webster’s 3rd International Dictionary, 2002). Widespread use of the term “Hispanic” began in the 1970s, when the Census asked individuals to self-identify as Mexican, Puerto Rican, Cuban, Central/South American or “other Hispanic.” Although the terms Hispanic and Latino are used interchangeably, the connotations are different. The Latino National Survey (2006) found that 35% of respondents preferred the term “Hispanic,” whereas 13.4% preferred the term “Latino.” More than 32% of respondents reported either term was acceptable, and 18.1% indicated they did not care (Fraga et al., 2006).Origin can be viewed as the heritage, nationality group, lineage, or country of birth of the person or the person’s parents or ancestors before their arrival in the United States (U.S. Census Bureau, 2000). People who identify their origin as Spanish, Hispanic, or Latino may be of any race (Black/African-American, White/Caucasian, Asian, or Native American) or of mixed race. In the 2000 census, seven million respondents designated themselves as multicultural: 48% of Hispanics identied as “White only,” 2% of Hispanics identied as “Black only,” 42% of Hispanics identied as “Some other race,” and 17% of Hispanics also reported belonging to two or more races.According to the 2008 U.S. Census Bureau population estimate, about 46.9 million Hispanics live in the United States (representing 15% of the total U.S. population). Among Hispanic subgroups, Mexicans ranks as the largest (66%) followed by Central and South Americans (13%), Puerto Ricans (9.4%), Cubans (3.9%), and people of other Hispanic origins (7.5%). Hispanics/Latinos are a fast-growing, diverse population in the United States. With their growth surging nearly 58% from 1990 to 2000, Hispanics/Latinos have more than four times the growth rate of the U.S. population (U.S. Census, 2008a). will help you communicate with Hispanics/Latinos more effectively. CS231924 2 Insights into the Hispanic/Latino Culture 1. By 2011, nearly one in six people living in the United States will be of Hispanic/Latino origin (Selig Center for Economic Growth, 2006). 2. The traditional patriarchal structure grants the father or oldest male relative the greatest authority, whereas women are expected to show submission (Kemp & Rasbridge, 3. Hispanics come from a collectivistic culture where group activities are dominant, responsibility is shared, and accountability is collective. Because of the emphasis on collectivity, harmony and cooperation in the group tend to be emphasized more than individual function and 4. Demographically, Hispanics/Latinos are younger than the non-Hispanic population. The median age of the Hispanic/Latino population in 2006 was 27.5 years compared with that of the U.S. population at 36.9 years. In fact, 62.7% of Hispanics/Latinos are age 34 years or younger (American Community Survey, 2008). 5. Income levels are rising. Although the Hispanic/Latino median income is lower than the U.S. average, data suggest that more Hispanics/Latinos are moving into the middle class (earning at least $40,000). In addition, Hispanics/Latinos are an increasing proportion of the total af�uent market (de�ned as adults with household incomes of $100,000 or more). From 1991 through 2000, the growth of af�uent Hispanics/Latinos rose 126% (U.S. Census, 2008b). 6. Hispanic/Latino teens are a growing segment. In 2006, 1. million) of the U.S. teen population and accounted for more than 38% of the total Hispanic population in the United States (Cheskin Research, 2006). 2. Hispanics live longer. Despite having a lower income than white Americans, Hispanics live longer than whites. Hispanics have an average life-expectancy of 75.1 years for men and 82.6 years for women compared with white Americans of 74.8 years for men and 80.1 years for women (U.S. Census Bureau, 2008a). 3. Getting diseases is a bigger concern than dying. For the Hispanic community, issues of morbidity rather than mortality are of greatest concern, which include lifestyle and behaviors affecting health; environmental factors such as exposure to pesticides, unclean air, and polluted water; and the ongoing need for more effective use of existing health services (National Alliance for Hispanic 4. Household size is larger. The average size of Hispanic/for the total population. In addition, the average family size of Hispanics (3.92 people) is greater than that of the total U.S. population (3.22 people) (American Community Survey, 2008). 5. Children are a big part of family households. In 2008, there were 10.4 million Hispanic family households: 62% included children younger than 18 years; 66% consisted of a married couple; 43% included a married couple with children younger than 18 years; and 70% of Hispanic children lived with two married parents (U.S. Census, 2008a).can help youto communicate more effectively with specic cultures in order to inuence their behavior. CDC’s Strategic and Proactive Communication Branch (SPCB) in the Ofce of the Associate Director for Communication provides CDC programs with culture-specic information such as needs, preferences, and characteristics. SPCB also provides marketing expertise and communication planning. To develop , data is collected and analyzed from books, articles, CDC-licensed consumer databases, and the Internet. For more information, contact Fred Fridinger, SPCB Branch Chief, at FFridinger@cdc.gov 3 Targeting Health CommunicationKnowing the habits and preferences of Hispanics/Latinos can help you tailor compelling health messages for this audience. these have proven to be an effective way to communicate with the Hispanic/Latino market. Companies such as Sears and Procter & Gamble have invested millions of dollars to reach (and in Spanish that address their lifestyle interests and needs (Doublebase Mediamark Research & Intelligence, 2009). English-language celebrities “who happen to slip in some Spanish.” Hispanic/Latino teens it mirrors their own usage patterns (Cheskin Research, 2006). Use radio and television. Research shows that although Hispanics consume every media type, they seem to have a special attraction to radio and television. These are proven, effective channels in targeting Hispanics (Sonderup, Be sensitive to language, which has less to people attach to it. For Hispanics/Latinos in the United States, Spanish is a key marker of social, personal, and political identity. As a result, Spanish-language TV remains important for even those who are uent English speakers and who regularly watch English-language TV. In communicating with Hispanics, it is not an either/or question but a matter of carefully integrating both (Tracy, 2004). Consider starting with the differentiation of U.S. born and non-U.S. born. By doing that, you will know certain facts about them that will help you reach and communicate with them (Tracy, 2004). Understand that it is important to target health messages to men as well as to women. Hispanics typically subscribe to values of “machismo” and “marianismo,” which culturally dene the desirable male and female qualities. True to these values, men are often reluctant to consult physicians for health to an emergency room is needed. Fathers or husbands may make other family members, especially their wives and daughters, wait until the last minute to obtain care or may take an uncooperative stance on the health care needs of family members (Parangimalil, 2001). Coordinate community outreach activities through established and trusted organizations and people. For example, promotorastrusted community health advisors and can be accessed through Community Health Centers. They visit homes and individually work with families (Maurana & Rodney, 2000). assimilating to prevalent U.S. culture, but they are not, and probably never will be, fully assimilated. Instead, theirs is a path of acculturation. It is a process of integrating native and traditional immigrant cultural values with dominant cultural ones (Sonderup, 4 Knowing your Audience Know that culture is central in their health habits. Four characteristics have been consistently identied as inuencing health habits and should be reected in communication: 1. A reliance on traditional healing systems is common not only because it is culturally approved but also because of the lower costs involved. Expensive modern medical care is unaffordable for many. 2. Collectivist values or group orientation permeates Hispanic life, and individuals often look to one another for opinions. A collectivist orientation may serve as a valuable asset for health promotion. For instance, dissemination of information about good health habits can be easily achieved in a cost-ef�cient manner. 3. Emphasize cultural diversity within the Hispanic population when conducting health assessments and promotion activities. Subgroups of the Hispanic population such as Mexicans, Puerto Ricans, and Cubans differ in their lifestyles, health beliefs, and health practices. 4. Many recent immigrants are less educated than their U.S. counterparts. They may live a marginal life here, on minimal incomes from low-paying jobs, without health insurance or other fringe bene�ts. The acculturation struggle then becomes a source of stress leading to interpersonal con�icts, family breakdowns, and health problems. Hispanics often accord health-related concerns a secondary relevance only, and traditional health- and illness-related habits and behaviors linger (Parangimalil, 2001). Because of their collectivistic values and tendency to look to others to help guide decisions and opinions, consider reaching them through social networks such as Facebook and MySpace, which facilitate such collective sharing of information and communication. A recent survey found 44% of English-preferring Hispanics and 35% of Spanish-preferring Hispanics visit MySpace regularly, which is greater than any other ethnic group. Facebook was regularly visited by 18% of English-preferring Hispanics and 13% of Spanish-preferring Hispanics compared with 7% of non-Hispanic Whites (Korzenny & Vann, 2009). When deciding where to focus health marketing and communication efforts, consider where most Hispanics live. For example, the three primary country groups demonstrate afnities for different regions, creating their own areas of concentration nationwide. Most Mexicans live in the West (55%), 77% of Cubans live in the South, and 59% of Puerto Ricans live in the Northeast (U.S. Census Bureau, 2008a). U.S. Hispanic Population, 2008 Top 10 states Population California 12,146,508 Texas 8,269,407 Florida 3,300,333 New York 2,881,409 Arizona 1,711,429 Illinois 1,533,767 New Jersey 1,221,616 Colorado 918,899 New Mexico 841,285 North Carolina 571,307 Source: Pew Hispanic Center, 2008. 5 Media Habits Average Media Usage Media type Averages Total U.S. population Hispanic/Latino population Magazines: Issues read in a month 11.60 12.70 Newspapers: Issues read in a 28-day period 19.90 17.20 Radio: Half-hours listened to in a week 35.80 38.50 Television: Half-hours viewed in a week 62.60 57.10 Internet: Times used in a month 77.60 69.30 Source: Doublebase Mediamark Research & Intelligence, 2009. Magazines Overall, Hispanics said that the main reason they read magazines is to keep up-to-date on the latest styles and trends (61%) (Doublebase Mediamark Research & Intelligence, 2009). Top 5 Magazines Read by Hispanics (last 6 months) % People 43 People en Español 30 National Geographic 29 Time 25 Sports Illustrated 24 Source: Doublebase Mediamark Research & Intelligence, 2009. 6 Newspapers The top reason that Hispanics reported for reading newspapers is because it keeps them informed and up-to-date (55%) (Doublebase Mediamark Research & Intelligence, 2009). Minority newspapers are an inseparable part of the local minority community. These newspapers deliver what no other mass medium can—news that is specically geared to the needs and concerns of individual minority communities (Sonderup, 2010). Newspaper readership skews to the adult 34–54 year age group with an average annual household income of $40,000 or greater (Sonderup, 2010). Radio The top reason that Hispanics reported for listening to the radio is because it puts them in a good mood (56%) (Doublebase Mediamark Research & Intelli - gence, 2009). A unique aspect of Spanish-language radio stations is the time spent listening. The Hispanic population often listens to the radio all day. The entire family may listen to one station and tune in, on average, 26–30 hours per week. This ranks more than 13% above the general population (Sonderup, 2010). Top 5 Radio Formats Preferred by Hispanics % Hispanic 39 Contemporary hit radio 29 Adult contemporary 18 Mexican/Tejano/Ranchera (subset of Hispanic) 17 Urban 17 Source: Doublebase Mediamark Research & Intelligence, 2009. Top 5 Radio Networks Preferred by Hispanics % Dial Global Contemporary Network 27 Dial Global Complete FM Network 26 Premiere Mediabase Female 25 Premiere Diamond 20 Dial Global Female Perspective 20 Source: Doublebase Mediamark Research & Intelligence, 2009. 7 Television Hispanics reported that the top reason they watch television is purely for entertainment (77%) (Doublebase Mediamark Research & Intelligence, 2009). 49% of U.S. Hispanics who watch television during prime-time hours watch Spanish-language programming (Sonderup, 2010). 40% of Spanish-dominant Hispanics regularly watch English-language programming (Sonderup, 2010). 30% of English-dominant Hispanics regularly watch Spanish programming (Sonderup, 2010). Top TV Shows Watched by Hispanics (2–4 times in last month) English-language TV Nielsen rating Spanish-language TV Nielsen rating American Idol (Fox) 6.5 Mañana es para Siempre (Univi - sion) 22.1 Dancing with the Stars (ABC) 5.4 Gran Estreno (Univision) 18.3 Grey’s Anatomy (ABC) 4.7 Cuidado con el Angel (Univision) 17.5 CSI: Miami (CBS) 3.6 Mujeres Asesinas (Univision) 16.5 House (Fox) 3.6 Aquí y Ahora (Univision) 15.0 Source: Nielsen, 2009. Note: These ratings are based on Hispanic viewership who watched the program while it aired and those who viewed the shows via digital video recorder within 24 hours of the program’s airing. The rating is the percentage of households watching a TV program out of the potential audience of 11.63 million Hispanic households. 8 Internet Overall, the main reason Hispanics reported that they used the Internet was because it is a good source of learning (64%) (Doublebase Mediamark Research & Intelligence, 2009). Total Hispanics using the Internet in January 2010 was 23,625,000—an increase of 3.3 million users from the previous year (comScore Media Metrix, 2010). 45% of Hispanics (10.55 million) now use Facebook (comScore Media Metrix, 2010). 36% of English-preferring Hispanics visit social networking sites at least two or three times a month (Korzenny & Vann, 2009). When segmenting by age, Spanish- preferring Hispanics 35 years of age and younger are the least likely to use social media (33%) compared with 58% of English-preferring Hispanics and 57% of non-Hispanic Whites. Among those older than 36 years, both English-preferring Hispanics (24%) and Spanish-preferring Hispanics (23%) are the most likely to visit social networking sites more than two or three times a month (Korzenny & Vann, 2009). Hispanics who use the Internet are young and afuent. They have large households, are “more enthusiastic about the benets of the Internet than the general market,” and are sophisticated technology users (AOL Advertising & Cheskin Research, 2010). Top 5 Websites Visited by Hispanics (last 30 days) % Google sites 78 Yahoo! sites 78 Microsoft sites 72 Facebook.com 45 Ask Network 38 Source: comScore Media Metrix, 2010. 9 Priority Health Concerns Hispanics have lower mortality rates than the overall population but are at greater risk for a number of chronic illnesses and diseases. Hispanic populations exhibit many positive health indicators in terms of diet, low levels of smoking and illicit drug use, and strong family structure. However, the longer each generation resides in this country, the more these positive indicators tend to deteriorate (National Alli - ance for Hispanic Health, 2004). Hispanics share a range of sociocultural character - istics, as well as national, experiential, and in some instances, genetic make-up, which can impact their health status within the United States. For example, certain cultural factors such as a traditional diet and lower rates of smoking among women impact favor - ably on their health status. Other factors like low- immunization rates linked to low-economic status and fear of authority among new immigrants have negative consequences. Acculturation among new immigrants and their children seems to weaken the positive health factors and lead to the adoption of negative ones from U.S. culture (such as smoking, alcohol use, and early sexual activity). Here are the top ten leading causes of death for Hispanics of all age groups: 1. Heart disease 2. Malignant neoplasms 3. Accidents and adverse effects 4. Human immunode�ciency virus infection (HIV) 5. Homicide and legal intervention 6. Cerebrovascular diseases 7. Diabetes mellitus 8. Chronic liver disease and cirrhosis 9. 10. Certain conditions originating in the prenatal period Source: National Alliance for Hispanic Health, 2004. 10 The top two leading causes of death are the same for the Hispanic and the non-Hispanic white population: heart disease and cancer (National Alliance for Hispanic Health, 2004). The 2009 edi - tion of Cancer Facts & Figures for Hispanics/Latinos reports that Hispanic/Latino Americans have a unique cancer prole that requires a targeted approach to cancer prevention. Hispanic/Latino Americans are less likely than non-Hispanic whites to develop and die from all cancers combined as well as the four most common cancers (female breast, prostate, colorectum, and lung). However, Hispanics have higher rates of several cancers related to infections (stomach, liver, and cervix) and are more likely to have cancer detected at a later stage (American Cancer Society, 2009). The proportion of recent adult Mexican immigrants who characterize their health as fair to poor is lower than that of long-term Mexican immigrants, U.S.-born Mexican Americans, and U.S.-born non-Latino whites. Even after age differences are factored, Mexican immigrants report fewer chronic conditions overall, spend fewer days in bed because of illness, and have lower mortality rates than U.S.-born non-Latino whites (Dey & Lucas, 2006; Turra & Goldman, 2007). 11 Health Care-Seeking Behaviors Many Hispanics combine traditional health care practices with Western medicine. Although the use of Western medicine tends to be prevalent, Hispanics who cannot afford these services often resort to traditional practices (Livingston & Kahn, 2009). Traditional practices include using home remedies (e.g., drinking herbal or spiced teas) and seeking care from relatives, neighbors, community members, or traditional health care providers. Although the matriarch often determines when a family member needs medical care, the male head still gives permission to seek treatment (Smith, 2000). Some medications sold only by prescription in the United States, including antibiotics, may be purchased easily without a prescription from Mexican farmacias (pharmacies). Regardless of their insurance status, Mexicans living in the United States may make regular trips to Mexico to purchase medications at a lower cost (Becker, Garcia, & Ellertson, 2004; Calvillo & Lal, 2003; Flores, Ochoa, Briggs, Garcia, & Kroeger, 2003). Hispanics have the highest uninsured rates (32%) of any racial or ethnic group within the United States. They are twice as likely as the overall U.S. population (15%) to lack health insurance coverage. Among foreign- born Hispanics, the uninsured rate climbs to 50%. Those without health insurance varied among Hispanic subgroups: 49.3% of Hondurans, 47.9% of Guatemalans, 38.9% of Salvadorans, 34.8% of Mexicans, 34.7% of Ecuadorians, 30.2% of Peruvians, 26.4% of Colombians, 23.4% of Dominicans, 22.7% of Cubans, and 15.6% of Puerto Ricans. (Pew Hispanic Center, 2010). Research suggests a lack of health insurance results in fewer visits to primary care physicians (Hough et al., 1987; Trevino, Moyer, Valdez, & Stroup-Benham, 1991) and more emergency room visits (Smith, 2000). Occupations that rely heavily on Mexican immigrant labor pay low wages and seldom offer health insurance, which poses health risks for workers and their families (National Population Council of the Government of Mexico & University of California, 2005). 12 Traditional Health Beliefs and Practices The meaning of health varies among Hispanics. Some maintain that health results from good luck or is a reward for good behavior (Spector, 1996). Illnesses are thought to have either natural or su - pernatural causes. Some common folk illnesses, causes, and remedies include: Humoral Imbalance In general, physical and mental illness is thought to result from an imbalance between a person and the environment, expressed as either “hot” and “cold” or “wet” and “dry” (Kemp & Rasbridge, 2004; Spector, 1996). The four humors contained in the body include blood (hot and wet), yellow bile (hot and dry), phlegm (cold and wet), and black bile (cold and dry) (Spector, 1996). To correct an imbalance, people consume foods or herbs with the opposite quality (e.g., “cold” conditions are treated with “hot” medications) (Smith, 2000). Empacho Illness can also result from a “dislocation” of different parts of the body. Empacho, an example of dislocation, is a form of upset stomach or indigestion thought to be caused by eating the wrong food at the wrong time of day, eating undercooked food, or swallowing gum. The most common treatment is rubbing the stomach or back gently with cooking oil and pinching the spine (Smith, 2000: Spector, 1996). Mal de Ojo “Bad eye” is caused when someone looks with admiration or jealousy at another person. The person looked upon experiences malaise, sleepiness, fatigue, and severe headache. Folk remedies include saying a prayer while passing an egg over the victim’s body then placing the egg in a bowl under the victim’s bed overnight, or alternately, having the person who caused the mal de ojo care for the victim (Kemp & Rasbridge, 2004). Envidia Many Mexicans believe envidia , or envy, causes illness and bad luck. Envy can be provoked by success but can result in misfortune and illness. Some research concludes that low economic status is associated with the belief in envidia (Spector, 1996). Susto Also known as fright sickness, susto arises from a traumatic or frightening experience and is thought to cause soul loss, whereby the soul leaves the body and wanders freely (Kemp & Rasbridge, 2004). Symptoms include anxiety, depression, insomnia, introversion, irritability, lethargy, and anorexia. Tuberculosis is sometimes classied as susto (Kemp & Rasbridge, 2004; Spector, 1996). 13 Cultural Elements Cultural elements are categories of things and ideas that identify the most profound aspects of cultural inuence (Smith, 1966). Several researchers have identied ve cultural elements: Material culture : things and ideas Social institutions : schools, governments, religious organizations Belief systems : ideas about individuals and the universe Aesthetics : art, dance, music, theater Language : verbal and nonverbal communication systems (Cateora & Hess, 1979; Hofstede, 1980; Samovar & Porter, 2001). As we mature, we learn to value these cultural elements. You were not born knowing what you liked in music, clothes, and automobiles. Through enculturation , the process of communicating a group’s culture from generation to generation, you learned what you liked by choosing from among the elements available within your culture (Smith, 1966). Your friends, colleagues, the media, and most importantly, your family, communicate information about these elements and advocate choices for you to make. Cultures are not static. Cultures change as new information and new inuences penetrate group’s stores of knowledge. Some changes come about as a result of scientic discoveries (i.e., we no lon - ger believe that bathing is unhealthy or that we can safely use makeup containing lead). But other changes take place through acculturation where we acquire other approaches, beliefs, and values by coming into contact with other cultures (Smith, 1966). Material Culture 83.4% of Hispanics/Latinos are private wage and salary workers compared with 79.0% of the general population (American Community Survey, 2008). Of Hispanics in the civilian labor force, 79,400 are chief executives; 50,866 physicians and surgeons; 48,720 postsecondary teachers; 38,532 lawyers; and 2,726 reporters, news analysts, and correspondents (U.S. Census Bureau, 2008b). Aesthecs Material Culture ABC LanguageBelief SystemsSocial Instuons Cultural Elements Categories of things and ideas that iden�fy the most profound aspects of cultural influence. 14 Occupations Civilian employed popu - lation 16 years and older Mexican population (13,119,496) % Puerto Rican population (1,683,817) % Cuban population (755, 475) % Total Hispanic/ Latino population (20,663,445) % Total U.S. population (146,266,253) % Management, professional, and related 15.5 26.8 31.7 18.4 34.9 Service 24.6 21.7 16.9 24.4 17.1 Sales and ofce 20.9 29.0 27.3 22.2 25.5 Farming, shing, and forestry 3.3 0.3 0.2 2.3 0.7 Construction, extraction, main - tenance, and repair 17.0 8.3 9.8 15.2 9.3 Production, transportation, and material moving 18.8 13.9 14.0 17.5 12.5 Source: U.S. Census Bureau (2008a); American Community Survey (2008). In 2002, there were 1.6 million Hispanic-owned businesses in the United States. Nearly 43% of Hispanic-owned rms operated in construction, administrative and support, waste management and remediation services, and other services such as personal services and repair and maintenance (U.S. Census Bureau, 2008b). 44.6% of Hispanic-owned rms were owned by Mexicans, Mexican- Americans, and Chicanos (i.e., U.S. citizens of Mexican descent) (U.S. Census Bureau, 2008b). 15 Social Institutions The religious afliation of Hispanics/Latinos in the United States is 68% Catholic, 20% Protestant, 8% Secular, 3% Other Christians, and 1% Other Faiths. Renewalist Christianity, which emphasizes God’s ongoing, day-to-day intervention in human affairs through the Holy Spirit, appears to be much more prevalent among Hispanics than among their non- Latino counterparts. Two-thirds of Hispanic/Latino worshippers attend churches with Latino clergy, where services are offered in Spanish, and where most other worshippers are Hispanic/Latino. Source of Social Institutions: Pew Hispanic Center, 2007. Educational Attainment Population 25 years and older Mexican population (15,816,915) % Puerto Rican population (2,375,539) % Cuban population (1,139,940) % Total His - panic/La - tino population (25,557,507) % Total U.S. population (200,030,018) % Less than high school diploma 45.2 27.1 24.4 39.2 15.0 High school graduate (or equivalent) 25.7 28.9 27.3 26.0 28.5 Some college or associates’ degree 20.1 28.2 22.9 21.9 28.8 Bachelor’s degree 6.5 10.7 15.9 8.9 17.5 Graduate or professional degree 2.5 5.1 9.5 4.0 10.2 Source: U.S. Census Bureau (2008a); American Community Survey (2008). 16 Belief Systems Most Hispanics believe that God is an active force in everyday life. Most Latinos pray every day, most have a religious object in their home, and most attend a religious service at least once a month (Pew Hispanic Center, 2007). Faith and church are often central to family and community life; this is especially apparent in the understanding of illnesses and healing (Kemp & Rasbridge, 2004). Familismo is the value of family over individual or community needs and the expression of strong loyalty, reciprocity, and solidarity among family members (Smith, 2000). Aesthetics The Chicano movement of the 1960s and 1970s brought about a new assertiveness in how Mexican Americans saw themselves in a new America. This political and cultural movement, identied as La Raza, sprouted a related art scene made publicly famous by its bold and colorful wall murals. Several groups or coalitions are designed specically to promote the work of Hispanic artists. Hispanics/Latinos have many holiday celebrations that are not generally celebrated by others in the United States such as La Semana Santa (Easter Holy Week), Three King’s Day or El Dia De Los Tres Magos on January 6th, Día De los Muertos or Day of the Dead on November 1st and 2nd, The Feast of Our Lady of Guadalupe on December 12th, and Las Posadas (the nine days prior to Christmas Day) (Winchester, 2000). Food plays an important role in the Hispanic culture. In some Hispanic cultures, a good meal will be balanced in food and herbs by “hot” and “cold” types. Those who eat foods whose temperatures are wrong for them can get sick. A good appetite is associated with good health. Children are not forced to eat foods that they resist because their preferences are respected. A mother or grandmother will withhold a food she thinks causes illness from her children’s diet. A list of harmful foods is passed along from generation to generation, with other food beliefs, from mother to daughter (Sanjur, 1994). 17 Language Most immigrants speak English regularly, and the younger ones also make it their preferred language of use. Some of the younger Hispanics/Latinos abandon the use of Spanish altogether (Rodriquez-Reimann et al., 2004). Verbal communication is courteous and respectful using the Spanish usted form (i.e., the formal, polite “you”) to address others (Guarnero, 2005). In nonverbal communication, maintaining eye contact can be interpreted by Mexicans as a challenge or intimidation (Guarnero, 2005). Hispanic social norms emphasize the importance of communication (verbal and nonverbal) in interpersonal relationships (Salimbene, 2000; Smith, 2000). Language Spoken at Home and Ability to Speak English Population 5 years and older Mexican population (26,990,822) % Puerto Rican population (3,788,020) % Cuban population (1,513,610) % Total Hispanic/ Latino popula - tion (41,638,535) % Total U.S. population (283,149,507) % English only 23.8 33.6 16.6 23.7 80.3 Language other than English 76.2 66.4 83.4 76.3 19.7 Speak English less than “very well” 38.4 19.7 41.7 37.3 8.6 Source: U.S. Census Bureau (2008a); American Community Survey (2008). 18 Overview of Characteristics of Hispanic/Latino and U.S. Populations Characteristics of the Mexican, Puerto Rican, Cuban, Hispanic/Latino and U.S. Populations, 2008 Mexican population (30,738,559) Puerto Rican population (4,216,533) Cuban population (1,617,010) Total Hispanic/ Latino popula - tion (46,891,456) Total U.S. population (304,059,728) Place of birth Native Foreign born 19,396,872 11,341,687 4,172,775 43,758 651,239 965,771 29,080,677 17,810,779 266,098,793 37,960,935 Citizenship status Foreign born; naturalized U.S. citizen Foreign born; not a U.S. citizen 2,503,127 8,838,560 23,365 20,393 564,248 401,523 5,111,667 12,699,112 16,329,909 21,631,026 Year of entry 2000 or later 1990–1999 Before 1990 31.4% 31.8% 36.7% 26.1% 27.2% 46.7% 22.3% 20.3% 57.4% 31.1% 30.2% 38.7% 29.5% 28.6% 41.9% Median age 25.7 29.0 41.4 27.5 36.9 Marital status Married Never married Divorced Widowed Separated 48.2% 38.6% 6.9% 3.1% 3.2% 37.1% 43.3% 11.2% 4.2% 4.3% 49.2% 27.3% 12.7% 7.9% 2.8% 46.4% 38.4% 8.1% 3.6% 3.5% 49.7% 31.2% 10.7% 6.2% 2.1% Fertility (women age 15–50 who gave birth in the prior 12 months) 37.7% 56.3% 23.8% 38.7% 34.3% 19 Median income Individual Household Family $14,329 $40,647 $41,538 $18,036 $39,039 $43,944 $24,736 $42,724 $51,290 $16,027 $41,470 $43,437 $27,589 $52,029 $63,366 Poverty status Families All people 20.7% 22.9% 21.1% 24.0% 11.0% 14.2% 19.0% 21.3% 9.7% 13.2% Homeownership 50.6% 40.2% 59.7% 49.1% 66.6% Source: U.S. Census Bureau (2008a); American Community Survey (2008). 20 References* American Cancer Society (2009). Cancer facts & gures 2009 . Atlanta: American Cancer Society. American Community Survey (2008). Selected population prole in the United States—Hispanic or Latino (1- year estimates) . Washington, DC: U.S. Census Bureau. AOL Advertising & Cheskin Research (2010). Hispanic cyberstudy: Marketing to the Web’s most rapidly grow - ing population . Becker, D., Garcia, S., & Ellertson, C. (2004). Do Mexico City pharmacy workers screen women for health risks when they sell oral contraceptive pills over-the-counter? Contraception , 69 , 295–299. Beebe, S. A., Beebe, S. J., Redmond, M. V. (2005). Interpersonal communication: Relating to others (4th ed.). Boston, MA: Pearson. Calvillo, J. & Lal, L. (2003). Pilot study of a survey of US residents purchasing medications in Mexico: Demo - graphics, reasons, and types of medications purchased. Clinical Therapeutics , 25 (2), 267–277. Cateora, P, & Hess, J. (1979). International marketing . Homewood, IL: Irwin. Cheskin Research (2006). Hispanic teens are the new avatars of cool . Redwood Shores, CA: Cheskin Re - search. comScore Media Metrix (2010, March 11). Hispanic online population increases by 3.3 million, Top 20 web - sites . Dey, A. N., & Lucas, J. W. (2006). Physical and mental health characteristics of U.S. and foreign-born adults: United States, 1998–2003. Advance Data , 369 , 1–19. Doublebase Mediamark Research & Intelligence (2009). Hispanic/Latino market prole . New York: Magazine Publishers of America. Fraga, L., Garcia, J. A., Hero, R.; Jones-Correa, M., Martinez-Ebers,V., & Segura, G. (2006). Latino National Survey (LNS) , 2006. ICPSR20862-v2. Ann Arbor, MI: Inter-University Consortium for Political and Social Research. Doi:10.3886/ICPSR20862. Flores, W., Ochoa, H., Briggs, J., Garcia, R. & Kroeger, A. (2003). Economic costs associated with inadequate drug prescribing: An exploratory study in Chiapas, Mexico. Acta tropica , 88 (1), 57–68. Guarnero, P. (2005). Mexicans. In J. Lipson & S. Dibble (Eds.), Cultural and clinical care (pp. 330–342). San Francisco: UCSF Nursing Press. Gudykunst, W. B. (1998). Bridging differences: Effective intergroup communication . Newbury Park, CA: Sage. Hofstede, G. (1980). Culture’s consequences: International differences in work-related values . Beverly Hills, CA: Sage. Hofstede, G. (1984). Cultural dimensions in management and planning. Asia Pacic Journal of Management , 1 (2), 81–98. 21 Hough, R. L., Landsverk, J. A., Karno, M., Burnam, M. A., Timbers, D. M., Escobar, J. I., et al. (1987). Utilization of health and mental health services by Los Angeles Mexican Americans and non-Hispanic whites. Archives of General Psychiatry , 44 (8), 702–709. Kemp, C. & Rasbridge, L. A. (2004). Mexico. In Refugee and immigrant health: A handbook for health professionals (pp. 260–270). Cambridge: Cambridge University Press. Korzenny, F. & Vann, L. (2009, June). Tapping into their connections: The multicultural world of social media marketing. Quirk’s Marketing Research Review available at http://hmc.comm.fsu.edu/Publications/Reports . Livingston, G. & Kahn, J. R. (2002). “An American Dream Unfullled: the Limited Mobility of Mexican Americans.” Social Science Quarterly , 83(4), 1003–12. Maurana, C.A. & Rodney, M. M. (2000). Strategies for developing a successful community health advocate program. Family and Community Health , 23 (1), 40–49. National Alliance for Hispanic Health (2004). Delivering preventive health care to Hispanics: A manual for providers , p. 29–30. U.S Department of Health and Human Services, Health Resources and Services Administration. National Population Council of the Government of Mexico (CONAPO) and the University of California. (2005). Mexico – United States migration health issues . The Nielsen Company (2009). Available at: http://www.nielsen.com/us/en/insights/top10s/television.html Parangimalil, G. J. (2001). Latino health in the new millennium: The need for a culture-centered approach. Sociological Spectrum , 21 , 423–429. Pew Hispanic Center. (2007). Changing faiths: Latinos and the transformation of American religion. Washington, DC: Pew Research Center. Pew Hispanic Center (2010). Country of origin proles-Hispanics in the United States . Available at http://pewhispanic.org/data/origins/ . Rodriguez-Reimann, D. I., Nicassio, P., Reimann, J. O. F., Gallegos, P. I., & Olmedo, E. L. (2004). Accultura - tion and health beliefs of Mexican Americans regarding tuberculosis prevention. Journal of Immigrant Health , 6 (2), 51–62. Salimbene, S. (2000). What language does your patient hurt in? A practical guide to culturally competent patient care . Amherst, MA: Diversity Resources. Samovar, L. A., & Porter, R. E. (2001). Communication between cultures . Belmont, CA: Wadsworth. Sanjur, D. (1994). Hispanic foodways, nutrition, and health. Boston, MA: Allyn & Bacon. Selig Center for Economic Growth (2006). The multicultural economy report 2006 . Athens, GA: Selig Center for Economic Growth. 22 Smith, A. (2000). Ethnomed: Mexican cultural prole . Available at http://ethnomed.org/ethnomed/cultures/mexican/mexican_cp.html Smith, G. (Ed.). (1966). Communication and culture . New York: Holt, Rinehart and Winston. Sonderup, L. (2010). Hispanic marketing: A critical market segment. Advertising & Marketing Review . Spector, R. (1996). Health and illness in Hispanic American communities. In R. Spector (Ed.), Cultural diversity in health and illness (4th Ed., pp. 279–297). Stanford, CT: Appleton and Lange. Tracy, K. (2004). Reaching the U.S. Hispanic audience is easier said than done. Video Age International, 24 (5). Available at: www.videoageinternational.com/articles/2004/10/toc.html . Trevino, F. M., Moyer, M. E., Valdez, R. B., & Stroup-Benham, C. A. (1991). Health insurance coverage and utilization of health services by Mexican Americans, mainland Puerto Ricans, and Cuban Americans. Journal of the American Medical Association , 265 (2), 233–237. Turra, C. M. & Goldman, N. (2007). Socioeconomic differences in mortality among US adults: In - sights into the Hispanic Paradox, Journal of Gerontology: Social Sciences, 63(3), S184–S192. U.S. Census Bureau (2000). Census 2000. Washington, DC. U.S. Census Bureau (2008a). Population estimates—Hispanic or Latino . Washington, DC. U.S. Census Bureau (2008b). Hispanic Americans by the numbers . Washington, DC. Webster’s 3 rd International Dictionary (2002). latino . Winchester, F. (2000). Hispanic holidays . Mankato, Minnesota: Capstone Press. *Some websites may require registration to access the information. 23 For more information, contact Fred Fridinger, SPCB Branch Chief, at FFridinger@cdc.gov . http://www.cdc.gov/HealthCommunication / U.S. Department of Health and Human Services Centers for Disease Control and Prevention Ofce of the Associate Director for Communication Division of Communication Services Strategic and Proactive Communication Branch AUDIENCE: HISPANIC / LATINO POPULATIONSTRATEGIC AND PROACTIVE COMMUNICATION BRANCH CULTURAL INSIGHTS: HISPANICS/LATINOS Send your feedback or questions to @cdc.gov