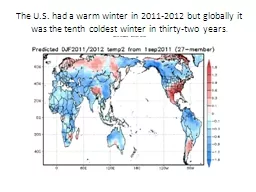
/
The U.S. had a warm winter in 2011-2012 but globally it was The U.S. had a warm winter in 2011-2012 but globally it was

The U.S. had a warm winter in 2011-2012 but globally it was - PowerPoint Presentation

celsa-spraggs
celsa-spraggs . @celsa-spraggs
Follow
416 views
Uploaded On 2015-11-30

The U.S. had a warm winter in 2011-2012 but globally it was - PPT Presentation

Source European Weather Service In spite of recent claims about 2014 being the warmest year on record significant cold can be found globally Data 01 january18 nov 2014 Mid year July 2013 temperatures also showed cooling ID: 210493

co2 solar temperature temperatures solar co2 temperatures temperature activity levels global source cycle years warming impact relationship clouds earth

Share:

Link:

Embed:

Download Presentation from below link

Download Presentation The PPT/PDF document "The U.S. had a warm winter in 2011-2012 ..." is the property of its rightful owner. Permission is granted to download and print the materials on this web site for personal, non-commercial use only, and to display it on your personal computer provided you do not modify the materials and that you retain all copyright notices contained in the materials. By downloading content from our website, you accept the terms of this agreement.


Presentation Transcript

Slide1

The U.S. had a warm winter in 2011-2012 but globally it was the tenth coldest winter in thirty-two years. Source European Weather ServiceSlide2

In spite of recent claims about 2014 being the warmest year on record, significant cold can be found globallyData 01 january-18 nov 2014Slide3

Mid year (July) 2013 temperatures also showed coolingSlide4

Global temperatures since 2000 show a cooling planetSource: NASA Earth ObservatorySlide5

Winter temperatures in the United States are getting dramatically cooler.Slide6

2013-2014 Winter temperatures in the USA were well below normal and many record lows were broken. The media called this a winter Vortex.Slide7

70% of the earth is ocean. Argo (part of the inter global observation strategy) measures the earth’s ocean temperature with over 3,000 buoys.

(Source: ARGO)

Slide8

Argo buoys dive 700 meters deep, surface, and then send their temperature data to satellites Slide9

Argo has discovered that ocean temperatures have not been warming. Some are actually cooling.

Argo has not found any “missing heat” in the deep ocean.

Slide10

Ocean surface temperatures in the past decade also show no overall warming, though there are short term influence of El Nino/La Nina which are driven by changing windsSlide11

The Pacific and Atlantic have roughly 30 year cycles (PDO, AMO) that are dominated alternately by heating or cooling. There is a very close relationship between these cycles and global temperatures in the 20th Century.

Source: Dr. Don EasterbrookSlide12

Let’s explore Carbon DioxideAtmospheric CO2 levels today are near the lowest level in the last 570 million years. CO2 levels were also higher than today for 85% of this time period.Slide13

We know much about the geology and climate of the past. In the Dinosaur Period, CO2 levels were as much as twelve times higher than today.Slide14

Three Ice Ages had much more CO2 than today.

Ordovician-Silurian Ice Age

- fifteen times more CO2

than today.

Cretaceous Ice Age

- five times more.

Permian-Jurassic Ice Age

- more CO2 than today as well.Slide15

In the past 600,000,000 years CO2 has not been observed to be a driver of the climate or even directly connected in any way to global temperature.Slide16

CO2 is a trace gas. It makes up less than 4/10,000ths of the atmosphere.Water vapor is 95% of greenhouse gasses.Slide17

Most CO2 does not come from man, but from natural sources. Only a small fraction is from man.Slide18

Rapid temperature change is a daily, seasonal occurrence

The difference between the

daily

low and high temperature can be as high as 35 deg F or more

Difference between record low and record high Virginia state temperatures is 140 degrees F

Mankind and nature survived these radical temperature changes, (they adapted)Slide19

Effect of CO2 on temperatures at two locations, each at the same latitude

Dry Desert

Humid JungleSlide20

The impact of humidity, H2O, and CO2 on high/low temperaturesThe slight impact of warming from CO2 can be demonstrated from the temperature changes between the low and high temperature in humid tropical and dry desert areas

Tropical areas are cooler in the day than the desert and are also warmer at night, due to the stabilizing effect of humidity.

In desert areas temperatures are both warmer in the day and cooler in night than tropical areas.

CO2 levels are about the same in both areas, yet the CO2 in the desert does not trap/retain the heat of the day. This demonstrates that CO2

by itself

does not cause much warming and how important water vapor is in stabilizing temperature.Slide21

CO2 is a greenhouse gas and does absorb heat. But the absorption is logarithmic, meaning the more CO2 there is in the atmosphere, the less heat it can absorb.Slide22

CO2 and heat absorption (sensitivity of CO2)There is general agreement that a doubling of CO2 would cause an increase in temperature,

by itself

, of between

+

1 Deg. C to + 1.5 Deg C

.

For there to be more warming than 1.0 deg C to 1.5 Deg C,

positive feedbacks

must form to amplify the warming still further.Slide23

Positive feedback, sometimes referred to as "cumulative causation", refers to a situation where some effect causes more of itself. A system undergoing positive feedback is unstable, that is, it will tend to spiral out of control as the effect amplifies itself.

(Source: Wikipedia)

Rising levels of CO2 can only cause temperatures to warm above about 1 to 1.5 degree C if they also causes more water vapor in the atmosphere/ heat trapping cirrus clouds/ and or a reduction in clouds.

*

But

observation shows this does not happen

.

*Rising temperatures causes more low level clouds to form, it rains and temperatures cool. Low level clouds are

negative

feedbacks

, they moderate temperature.Slide24

Some have accurately shown there is a relationship between temperature and CO2 in the past 450,000 yearsSlide25

But, the relationship is that temperature change precedes change in CO2 levels.In the 450,000 years of climate records extracted from the Vostok

Antarctic ice cores, temperature was constantly changing.

T

emperatures always changed first.Slide26

Temperature change precedes changes in CO2 because of ocean outgassing (cooling oceans can absorb more CO2 and warming oceans release CO2 to the atmosphere) and also changes in the amount biodiversity. A warm planet is greener and a cold planet is less green.Slide27

The theory of man made global warmingThe theory of man made global warming states that increases in atmospheric CO2 from man will absorb heat and cause temperatures to rise. This warming from additional concentrations of CO2 is said to cause

increasing levels of humidity

which in turn absorbs even more heat, creating a vicious cycle with rising temperatures spinning out of control.

If this theory were correct, why did runaway global warming not

occure

in earlier times, when atmospheric CO2 concentrations were much higher than today’s?

Temperatures and humidity also rise substantially in summer. This has not triggered runaway temperatures, either.

“Over geological time, there is no observed relationship between global climate and atmospheric CO2. “ Ian

Plimer

.Slide28

Observation shows that atmospheric humidity is not rising as CO2 levels increase.This directly contradicts the theory of AGW.

Data source:

NOAA Earth System Research LaboratorySlide29

NOAA Earth Systems Laboratory measurements have shown a decrease in upper atmospheric humidity since 1948. Lower atmospheric humidity allows heat to dissipate to space more quickly.Slide30

Not a single UN IPCC model accurately predicted the 17+ year pause in global warming. Also if the models were accurate they should also work backward, but they don’t.Slide31

CO2 is not a pollutant. It is essential for life on EarthCO2 levels were about 270ppm in the mid 1700s

(they are 400ppm today).

If CO2 levels fall below 150ppm, plants stop growing. Photosynthesis stops.

Most life on Earth was thus

close

to

extinction

during the glacial period of the ice ages due to a lack of atmospheric CO2 when CO2 levels fell to 180ppm.Slide32

What is the impact of higher CO2 levels on plant life?Plants evolved in a period when CO2 levels were much higher than today.Trees grow as much as 75% more quickly with a doubling of CO2.Slide33

Plants today grow 15% more quickly due to the higher level of CO2. Greenhouses raise CO2 levels to 1,000ppm to increase the growth rate of plants.Higher CO2 levels will help feed a growing world population.Slide34

Crop yields are increasing in part from rising levels of CO2Slide35

Plants evolved in a period when there was substantially more atmospheric CO2 than today.Plants benefit from rising levels of CO2.

Plants require less water to grow.

Arid areas of earth are greening and becoming

more productive agriculturally.

There will be less drought because plants water management improves with rising CO2 levels.Slide36

Would a warming planet lead to an increased risk of disease such as mosquito borne malaria? The answer is “no”.

Malaria is no stranger to the northern climates. The largest malaria outbreak of modern times was in Siberia in the 1920s and 1930s, when 13 million were infected and 600,000 died. 30,000 died as far north as Arkhangelsk, on the Arctic Circle. Alaska has also had similar outbreaks of Malaria.Slide37

Why has the earth been warming if not from rising CO2 levels? The Sun may be one answer.Slide38

The source for the warm temperatures we have and need to sustain life comes almost entirely from the Sun.

The Earth’s atmosphere and greenhouse gases are the reason its temperatures are not like those of the Moon, (-243 degrees F at night to +212 degrees F in day).

Many climate scientists fail to look to the heavens to take a closer view of the Sun.Slide39

Galileo was the first to observe Sunspots using a telescope.Slide40

Galileo’s drawing of sunspots in 1613Slide41

An active Sun on the left and inactive Sun on the right.Sunspots are used to track solar activity. Solar activity is not constant, the Sun has cycles that last an average of just under 11 years. We are now in solar cycle 24.Slide42

Changing solar activity is measured by observing and counting sunspots. Note how much solar activity has increased since measurement began in the year 1610. The prestigious Max Planck Institute in Germany said that solar activity in the 1980s was the strongest in the past 8,000 years.Slide43

Solar activity as measured by sunspots and temperature appear to be closely linked.source: Jean-Louis Le Mouel

, Vincent

Courtillot

, Elena

Blanter

,

Mikhail

ShnirmanSlide44

Sunspots have been counted for over 400 years. They are used to track the 11 year average length of the solar cycle. When there are fewer sunspots global temperatures cool (shown by the blue). There has been no deviation from this relationship over this period.Slide45

The observatory at Armagh Ireland has one of the longest continuous temperature records on earth. This chart tracks the close relationship between temperature from 1796 (as shown by the dots on the chart), and length of different solar cycles ( the solid line).

(source:

Armagh

Observatory)Slide46

Solar Irradiance has been steadily increasing since the early 1600s. NASA says changes in solar irradiance can have significant impact on global temperatures.Slide47

The intensity of the current solar cycle, cycle 24, is significantly lower than the prior two cycles. Solar activity is at the lowest level in nearly two centuries. Source: NASASlide48

The # of sunspots of solar cycle 24 as of 8/13 is 43% lower than the average of the previous 23 cycles. Source: Solar Influences Data Analysis Center (Brussels)Slide49

Solar activity is driven by the Sun’s internal magnetic field, (as measured by the AP Index). The AP index (solar magnetic field strength) in

Novemnber

2009 was at the lowest level since records began in 1932. Note that the low AP index in mid chart, was during the 1970s cooling scare.

Source David ArchibaldSlide50

The Solar magnetic field strength, the AP index, remains at very low levels and has not recovered from the shift which began in October 2005. Slide51

Solar cycle lengths from 1762. Cycle 23, which ended in 2009, is the longest

since

1788

, a cycle that predated a several decade long very cold period called the Dalton minimum. Longer cycles have fewer sunspots than shorter ones.

Source Anthony WattsSlide52

Temperature and solar records at De Bilt Netherlands 1705 - 2000, demonstrates the close relationship between solar cycle length and temperatures.With each additional year of cycle length above 11 years temperatures cool an average of 0.7 degrees C. at this location.

Source David ArchibaldSlide53

The central England temperature record since 1659 shows the same general relationship between solar cycle length in years and temperature. Slide54

Using the record of temperature and solar cycle length at Hanover New Hampshire since 1835, one can see that the short solar cycle 22 of the 1990’s was during a warm period and the 12.5 year long cycle 23 should result in a 2.0 degree C reduction in temperature (3.6 deg F) at this location over the expected life of solar cycle 24.

(Source: David Archibald, using

Friis

-Christenson Larsen theory)Slide55

The relationship between Solar cycle length and temperature at ten locations in Norway

With Solar Cycle 23 being 3 years longer than Solar Cycle 22, temperatures in Norway should decrease 0.6C to 1.8C in the next decade using historical data from the impact of previous Solar Cycles.

Source: Jan-Erik

SolheimSlide56

The years 2007, 2008, and 2009 have some of the lowest solar activity since 1849 (when modern records began) in terms of days without sunspots. This might explain why global temperatures have ceased to warm and there are signs of cooling.Source: Anthony WattsSlide57

Observation shows there appears to be an impact on global temperatures due to changes in solar activity.Slide58

Solar impacts on global temperatures.

The impact on the earth’s climate from the Sun goes beyond irradiance (heat) as measured in watts per square meter. Low solar activity has caused solar winds to decline over 30% . Ultra violet radiation levels have also been reduced. Cosmic rays reaching earth’s surface have also increased substantially.

Some scientists believe that changing solar activity affect global temperatures by causing changes within the atmosphere and especially the clouds. With today’s century low solar activity and record low solar winds, it is thought that the increase in cosmic rays that reach our atmosphere from deep in space cause more clouds to form. Clouds reflect up to 65% of solar radiation back into space, and when there are more clouds, temperatures cool. Conversely, increasing solar activity and the resulting increase in solar winds reduces the amount of cosmic rays that reach the atmosphere, fewer clouds form, more solar rays reach the earth’s surface, and this leads to higher temperatures.

If the past is a predictor of the future, the changes we now see in solar activity will

cause the temperatures to cool for the next 40 years or longer

. The Thames River at London could freeze once again as it often did during the Little Ice Age and into the early 1800’s.Slide59

Relationship between cosmic rays and cloud formation.Source: David ArchibaldSlide60

Lower solar activity (low solar magnetic field) allows more cosmic rays to enter Earth’s atmosphere. Some scientists believe that when cosmic ray levels are low, more low level clouds form, and this cools the Earth.Slide61

Cosmic rays from deep in space bombard the Earth and leave isotopes in the soil and tree rings. Past levels of solar activity can be matched against reconstructed temperature proxies.Slide62

Research has verified a close connection between cosmic rays and temperature. Studies of dripstones in Oman for the period 7500-4500 BC show a high degree of synchronicity between solar activity and temperature development. Figure modified after Neff et al. (2001)Slide63

Observation shows there is a correlation between cosmic rays, and low altitude cloud formation. Low level clouds reflect solar rays back into space, cooling the Earth’s surface.Source: Henrik

SvensmarkSlide64

As more clouds form they cool the oceans and later, atmospheric temperatures. Note the close relationship between solar cycles, ocean surface and atmospheric temperatures.Slide65

Low cloud cover has an impact on temperatures. Low level clouds cause surface air temperatures to cool.Source: David ArchibaldSlide66

This chart shows a close relationship between solar magnetic activity, (the AA Planetary Geomagnetic Index), and ocean surface temperature of the North Atlantic (NAO)Slide67

There is a strong relationship between solar activity (sunspots) and the global surface temperature. Source NOAASlide68

The UK Met Office and NASA predict that there is a 92% chance that low solar activity will continue for the next several decades and will be as low as the time period of the Dalton and Maunder Minimums, periods when global temperatures were significantly lower than today.Source: Livingston and Penn Solar Cycle Amplitude EstimateSlide69

What will global temperatures do in the next 20-40 years?

Never in the past has CO2 been a significant factor in determining temperature on Earth. The CO2 warming is so minor it can barely even be measured.

The Pacific and Atlantic surface temperatures run in roughly 30 year cycles (PDO, AMO), dominated by periods of cooling or warming. During the 1980s and 1990s warming period both cycles were in the warm dominated phases. The PDO is now in its cold phase. As the North Atlantic cools in coming years expect the Arctic ice extent to begin grow once again.

In the 1980s solar activity was the strongest in the past 8,000 years according to the Max Planck Institute but has weakened since. Low solar activity is expected to continue for the next several decades.

Volcanic activity also impacts global temperatures. Major volcanic eruptions emit fine particles into the upper atmosphere that block sunlight from reaching the Earth’s surface. Volcanic emissions create aerosols that seed cloud formation. This causes temperatures to cool. A major northern hemisphere eruption could influence the global climate for years.

If the past is a barometer of the future, overall global temperatures should noticeably cooler in the next twenty to forty years. This cooling appears to have already begun.Slide70

The Thames River last froze solid in London in 1814.Frost fairs were often held on the river during the Little Ice Age. We could see the Thames freeze once again due to declining solar activity.Slide71

We could also see the return of the frozen canals of the Netherlands, such as those depicted in the stories of Hans Christian Anderson.Slide72

The global population is growing quickly in third world countries. Early and late frosts from low solar activity could have catastrophic consequences in nations that are ill prepared for the loss of crops from freezing temperatures.Slide73

Conclusions I

The earth’s current warming trend started in the mid 1700s with the end of the Little Ice Age, long before CO2 was a factor.

Until we understand the natural forces that impact climate, models

cannot

be relied upon to predict future temperatures with accuracy.

CO2 does

not

have much direct impact on temperature.

Positive feedbacks caused by rising levels of CO2 have not been observed.

Rising CO2 levels have a beneficial impact on plant growth.

There is little loss of overall global polar ice, though some slow melting is normal. The melting of Arctic ice has

no

impact on sea level.

Sea levels have been rising for thousands of years,

and some rise is normal

Global hurricane intensity is at

fifty year lows

.Slide74

Conclusions II

Global atmospheric temperatures have not warmed for over 17 years even though CO2 levels continue to rise.

Polar bear populations are

growing.

Solar activity and temperature are closely linked. Today’s century low solar activity is causing temperatures to drop. Temperatures could fall as quickly as the 70’s cooling scare but they could become colder and last longer. This would cause the loss of several weeks in the growing season on both ends and result in reduced crop production. This could

have quit serious

impact on nations that lack adequate food supply.

(David Archibald)

Cold periods are much worse for humanity than warm ones.

Cold periods in the past have been ones of famine, disease, death and political instability.

Man has little impact on global temperatures.