/
Nutrient fields in the Bering Sea: available data and results Nutrient fields in the Bering Sea: available data and results

Nutrient fields in the Bering Sea: available data and results - PowerPoint Presentation

chaptoe
chaptoe . @chaptoe
Follow
344 views
Uploaded On 2020-07-01

Nutrient fields in the Bering Sea: available data and results - PPT Presentation

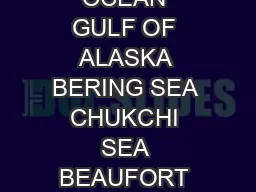
Kirill Kivva Russian Federal Research Institute of Fisheries and Oceanography VNIRO Ice margin IV and V and summer currents in the Bering Sea Introduction Sources Danielson et al 2011 ID: 792274

grid data ndec credits data grid credits ndec usa hexagonal 2009 2011 methods decades tinro khen jpn geodetic results

Share:

Link:

Embed:

Download Presentation from below link

Download The PPT/PDF document "Nutrient fields in the Bering Sea: avail..." is the property of its rightful owner. Permission is granted to download and print the materials on this web site for personal, non-commercial use only, and to display it on your personal computer provided you do not modify the materials and that you retain all copyright notices contained in the materials. By downloading content from our website, you accept the terms of this agreement.


Presentation Transcript

Slide1

Nutrient fields in the Bering Sea: available data and results

Kirill KivvaRussian Federal Research Instituteof Fisheries and Oceanography (VNIRO)

Slide2

Ice margin (IV and V) and summer currents in the Bering SeaIntroductionSources:

Danielson et al., 2011; Basyk, 2009; Khen, 2001; Khen et al., 2013; Coachman, 1986; Kinder and Schumacher, 1981; Kinney et al., 2009; Ladd, 2014; Panteleev et al., 2006, 2011; Stabeno et al., 2016; Verkhunov et al., 1995;

Slide3

WOD’13 (NODC, USA)JAMSTEC (R/V Mirai, JPN)BEST/BSIERP (USA)

TINRO-Center (R/V TINRO, R/V Professor Kaganovsky – credits: Dr. Vladimir Matveev, RUS)Hokkaido U. (R/V Oshoro Maru – credits: Dr. Toru Hirawake, JPN)BASIS (credits: Lisa Eisner, USA)CHINARE (CHN)

Data Sources

Slide4

Data collection in ODV (Schlitzer, 2016)Global geodetic grid creation with package rdgridR (

Barnes et al., 2017) – Icosahedral Snyder Equal Area Aperture 3 Hexagonal GridSpatio-temporal averaging with Gaussian weighting function and truncation radius of 100 kmSchematic visualization of dataExamples of synthesized resultsApproach

Slide5

Methods: hexagonal geodetic grid

Slide6

Mean bathymetry in every grid cell based on GEBCO (0,1° resolution)Methods: hexagonal grid scheme

Slide7

Number of decades with data (decades with ≥3 stations)Data: spatial data distribution

Ndec (DO)Ndec (Si)Ndec (P)N

dec (N-NO3

)

Slide8

Multiyear mean seasonal cycle of silicate Example of results

South-Eastern ShelfNorthern Shelf

Slide9

Synergetic effect of combined dataHexagonal grid perform quite wellApproach for other data analysis

Conclusion