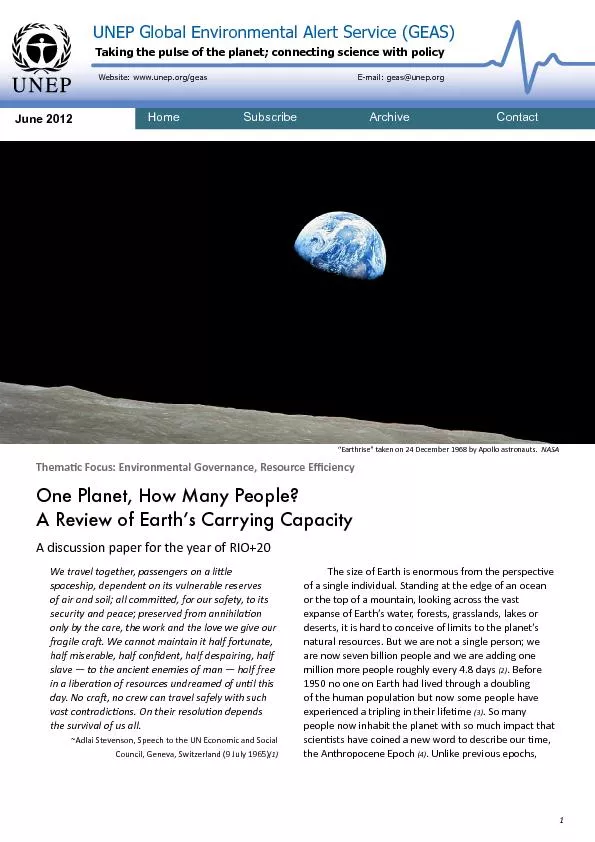
1 UNEP Global Environmental Alert Service GEASTaking the pulse of the planet connecting science with policy Email geasuneporgWebsite wwwuneporggeas Themax00740069c Focus Environmental G ID: 242691
Download Pdf The PPT/PDF document "Earthrise taken on 24 Decemb..." is the property of its rightful owner. Permission is granted to download and print the materials on this web site for personal, non-commercial use only, and to display it on your personal computer provided you do not modify the materials and that you retain all copyright notices contained in the materials. By downloading content from our website, you accept the terms of this agreement.
1 Earthrise taken on 24 December 1968 by Apollo astronauts.We travel together, passengers on a lile spaceship, dependent on its vulnerable reserves of air and soil; all commied, for our safety, to its security and peace; preserved from annihilaon only by the care, the work and the love we give our fragile cra. We cannot maintain it half fortunate, half miserable, half condent, half despairing, half slave to the ancient enemies of man half free in a liberaon of resources undreamed of unl this UNEP Global Environmental Alert Service (GEAS)Taking the pulse of the planet; connecting science with policy E-mail: geas@unep.orgWebsite: www.unep.org/geas Themac Focus: Environmental Governance, aesource Eciency where various natural regimes of geological processes dened the me periods, the Anthropocene is named for escalang human inuence on the environment. The release of CO into the atmosphere is beginning to alter the global climate. epecies are going exnct at a rate 100 to 1000 mes above the natural rate. The scale of human appropriaon of the products of photosynthesisthe most fundamental process of the biospherehas reached around one-quarter to one-third of all global Net Primary Producon (see box 1). We have become a major global geophysical force Aer roughly 100000 to 200000 years of modern humans remaining at very low numbers (and with a very minimal impact on the planet), our numbers began to grow around 4000 years ago. That growth began to accelerate over the following centuries unl we were adding more people each year than had ever lived on Earth at one me prior to 500 BCE (87 million added . While the rate of populaon growth in percentage terms is esmated to have peaked in the 1960s, the absolute number of people added each year connues to be staggering . The most recent billion arrivals were added in about 13 years; it took 12 years for the billion before that and 13 years for the billion before that. Even though the global growth rate peaked more than 40 years ago, it is esmated that there will be another billion added over the next 15 years and yet another billion before mid-century . The oN Populaon Division’s “medium-variant” projecon for the end of the century is now 10.1 billion Increasing Per Capita ImpactWhile global populaon has doubled since the 1960s, per capita GDP has grown to more than 10 mes what it was then . Per capita income for millions in the developing world including India and China is growing rapidly, creang enormous demand for material goods and services . Life expectancy has also increased globally by almost 20 years. That puts twice as many people on the planet, living about 40 per cent longer and each person consuming many mes what the average person in the 1960s did. Most developing economies are striving to close the gap between their living standards and those of developed economies. However, it has been esmated that “if everyone lived the lifestyle of the average American we would need ve planet Earths” to provide the needed land and ecosystem goods and services . Eiving standards and consumpon need not be directly equivalent to environmental impact While populaon is a mulplier of per capita impact, technological advances in eciency can be a divisor of per capita impact. However, so far development of technologies that can deliver goods and services eciently enough to stabilize environmental impact in the face of rapidly growing populaon remains a profound challenge . In other words, populaon growth is mulplying per capita impacts faster than technology (the divisor) is migang environmental impacts. It is not surprising that concerns about the number of people the Earth can support have re-emerged in the past decade. How Many People Can We Fit On epaceship Earth?epeculaon about the ulmate carrying capacity of the planet dates back at least to the 17th century. Dutch scienst Antoni van Eeeuwenhoek (1632-1723) esmated that if the populaon of Holland in his day (onemillion people) were extrapolated across the esmated area of inhabitable land around the globe, it would equal billion people. eince then many more esmates have been made as to how many people the Earth could (11,12). The range of these esmates is enormous, projected { Estimated Millions of People On EarthStonehenge completed in England,27 million people on EarthHistorical World Populationlast ice age ending, on earth Agriculture and 5 million people on EarthEarly cities in North Africa, Mesopotamia, and South Asia, 7.5 million people on EarthSettled rice cultivation and basketry in China,12.5 million people on EarthHieroglyphic script developed in Egypt,14 million people on Earth the Iron Age,on Earth The earliest known solar calendars carved by the Mayans, 162 million people on Earth Julius Caesar Roman Empire,on Earth Japan becomes centralized ,198 million people on Earth Kingdom of Zimbabwe,Earth Bubonic Plague begins, 443 million people on Earth peoplepeople people people people people people Figure 1: World populaon began accelerang about 4000 years ago and has “exploded” in the past 1 000 years. eource: oNEP-GaID eioux Falls; populaon data – oe Census Bureau 2011. projected { and rather than converging toward a narrower range over me, they have if anything, become more wide ranging in recent decades . A study looking at 94 dierent esmates of the upper bounds of Earth’s populaon found esmates ranging from a low of 500000 to a Why do these esmates vary so dramacally? Part of the variaon comes from the dierences in methods used (at least six) to esmate the limits of human populaon on Earth. One method was the above menoned approach used by Eeeuwenhoek. A problem with this method is that it must assume the inial populated area to be a valid example of a populaon which has reached the limits of its environment. This approach also assumes that the factors and dynamics constraining populaon in this sample area would apply for other areas. Many other studies have assumed a single constraining factor to esmate populaon limits maximum populaon that could be supported by the available food. These esmates could only be as valid (or invalid) as that assumpon of a single constraining factor and the method of calculang limits of that assumed constraint (e.g. food supply). A more sophiscated variaon of this method assumed a set of mulple possible constraints (say food, water and fuel), and whichever of these was in shortest supply would set the limit of populaon . This allowed for dierent constraints to be liming in dierent locaons, as in water in deserts or land area on an island. A sll more sophiscated approach idenes several constraining factors and also takes account of the interdependence of these variables This is the approach of dynamic systems modeling which develops a set of dened relaonships for mulple factors reecng their inuence on each other and ulmately on the limits of populaon. The degree to which humankind can change its interacon with the environment through technology cannot be foreseen. For example, availability of fossil fuels impacts food producon through ferlizer producon, pumping of irrigaon water, use of farm machinery, and so on. Current manufacturing methods for ferlizer producon rely heavily on natural gas. Guesses about future availability and cost of natural gas depend on assumpons about future technological advances in eciency. Alternavely, if an economically viable substute for natural gas in the producon of ferlizer could be found, then natural gas as a constraint on food producon would be diminished or eliminated. These uncertaines must be incorporated into esmang future agricultural land use eciency and by extension aect whether or not available farmland is ulmately an important constraint on populaon. As methods of esmang an upper limit for human populaon have become more sophiscated they have had to incorporate more factors, which oen can only be esmated or have uncertain values. Natural limits, such as those imposed by the climate system, are not fully understood and must be esmated from imperfect Figure 2: Esmates of Earth’s carrying capacity vary dramacally as this survey of 65 dierent esmates shows. models. We do not know how much CO can be released into the atmosphere before it may cause an abrupt change in the environment, for example. And, it is not yet possible to say with certainty how much rise in surface temperature there could be before the Antarcc Ice sheets would be at risk of collapse. Individual and societal choices as to the level of material that is necessary for well being and the deprivaons that would be tolerated in the future can be esmated within some plausible range, but cannot be known for certain. How much food, medicine, heat, clothing, shelter and water do we assume is required for each future inhabitant? How evenly can these be distributed? In the end, the outcome of aempts to dene a stac ceiling for sustainable human populaon seems desned to uncertainty. However, rather than esmang a stac upper limit of human populaon, it might be more important to understand the dynamics of the complex system upon which the survival of that populaon depends. Models that capture the key dynamics of the Earth system can serve as a map for choices that will impact our collecve future (however many of us there ulmately are). Modeling Our Future On EarthIn the early 1970s a group of computer sciensts at the Massachuses Instute of Technology (MIT) developed just such a model to help use dene safe limits to our impact on the Earth system. Aay Wright Forrester was a computer engineer at MIT and the founder of System Dynamics, a modeling approach for studying complex systems. Forrester realized that advances in computers he used for modeling of economic systems might enable modeling of the global economy and the global ecosystem as a single complex system . At the same me, a set of Forrester’s colleagues at MIT, headed by Dennis Meadows, also began working on the same type . The teams worked independently publishing their work in 1971 (Forrester’s “World Dynamics”) and 1972 (Meadows and others’ “The Eimits to Growth). The authors had simulated the relaonships of several of the Earth eystem’s key processes over me, and both teams came to similar conclusions. They found that Earths economic system tends to stop growing and collapse from reduced availability of resources, overpopulaon, and polluon at some point in the future. Various scenarios of technological innovaon, populaon control, and resource availability could delay the collapse, but only a carefully chosen set of world policies designed to stop populaon growth and stabilize material consumpon could avoid collapse”The books were quite successful, parcularly Meadows book The Limits to Growth, which was wrien for the layperson and translated into several languages . Many in the sciences responded enthusiascally and many tried to adapt the groundbreaking technical approach to their own elds of study . But in spite of their popularity, cricism came from several direcons as well. Many crics saw a polical meaning in the works , many dismissed it as alarmist , but the most enduring push-back came from mainstream economists In the past decade, however, many have begun to revisit the Limits to Growth and world modeling of Forester and Meadows . Several have pointed out that the projecons of the Meadows’ World3 model’s “business as usual” scenario are proving to be remarkably close to reality for the 40 years since they were rst published . New science, including advances in modeling dynamic systems such as the Earth System, is trying again to see what might lie in the future Eiving in the AnthropoceneThe past 10000 years, a period known as the Holocene to geologists, has given humankind a relavely stable environment during which human civilizaon and populaon have ourished. Human acvity is now having important inuence on the Earth’s climate and ecosystems . To most of the sciensts studying the planet it has become increasingly evident that there are limits to the human impact that our Earth System can absorb and sll remain in that Holocene-like state. Several crucial processes are believed to have thresholds which, once passed, could trigger abrupt and/or irreversible environmental changes at a global scaleFigure 3: The Limits to Growth was released in copies and drawing both accolades and cricism. The Club of aome It is feared that these changes could cause the stable environment of the Holocene to transion to a new state which could be detrimental or even catastrophic to humankindClimate change, caused by increasing atmospheric COmost widely known of these limits. However it is not the only limit that sciensts are concerned about. In parcular one group of sciensts working together through the Stockholm Resilience Centre has idened nine such key processes in the global ecosystem which they feel are being altered enough by human acvity to put the stability of the Earth System at risk . The graphic (Figure 4) shows those nine Earth System processes. Several of these are global in scale, such as climate change, ocean acidicaon, and stratospheric ozone. These can be understood as top-down in their impact. Others among the nine are local or regional processes which likewise have local and regional thresholds, but whose aggregate inuence is important at the global scale. These could be understood as “boom-up” in their global impact. One of the ideas most emphasized by the etockholm aesilience Centre is the suscepbility of key Earth eystem processes to “pping points.” They believe that exceeding these thresholds risks triggering abrupt environmental change. Think of the Earth System as a bus that is overloaded (Figure 5). Up to a point each new rider has a “linear” impact—causing the bus to lt a lile more when it turns. No one pays much aenon when another and then another rider climb on the bus. Aer all it just seems to cause the bus to lt a lile more each me. Then at some point, just one more added rider causes the bus to overturn as it rounds a corner. What had up to that point had a linear impactone passenger equals a lile more lt—reaches a pping point—one passenger equals an overturned bus. Connuing with the metaphor, several factors can inuence the pping, such as speed, weight of the passengers, condion of of these are contribung factors to the stress on the bus (e.g. weight of passengers) and others are factors which reduce the busses ability to handle that stress (e.g. the condion of the suspension). In a similar way some of the nine processes that are idened by the etockholm aesilience Centre’s work are primarily contribung factors in the sense of added stressfor example, climate change. On the other hand, some processes may also diminish the systems ability to absorb change, such as land use change. All of the processes are interconnected and the uncertainty about change in one process then introduces uncertainty into the whole system model. Because of this it is not possible to pinpoint exact thresholds where change in these processes would trigger a change in the state of the system. To return to the bus metaphor, we would have to know the weight of each passenger, the speed that the bus will travel in the future, the degree of turns the bus will make in the future, the condion of the AZOTEPlanetayBoundaries thenineredwedgesrepeset anestimte ofthecuret positionofeachbounday. Theinnergeenshading repesetsthepoposedsaeopeatingspace. Figure 4: The etockholm aesilience Centre’s Planetary Boundaries Framework idenes nine key Earth processes which serve as a sort of set of safety gauges for the Earth System. Figure 5: Like an overloaded bus, the Earth System is subject to pping points where linear addions of stress can lead to non-linear outcomes. suspension, and many other factors to know precisely when the bus will p over. However, we can see that the bus is approaching that threshold as it lts farther and farther with each added passenger. The point where the risk becomes intolerable, for either the bus or the Earth System, is not a clear black line. For the Earth System, we do not know the future state of several of the interconnected processes, such as land cover change and future CO emissions. This makes it impossible to give that precise number of passengers where the “bus will p over” but it may allow us to set a limit on passengers that minimizes the risk that it will. That there are some unsustainable possibilies which must be avoided is an emphasis of the Stockholm Resiliency framework. It could be said that they have devised and connue to rene a set of “safety gauges” for the planet. Three of those gauges are already in the danger zone and others are approaching it. Another emphasis of the Stockholm Resiliency Framework is (not surprisingly) resilience. In this context they mean the Earth Systems capacity to withstand perturbaons without transioning from the current Holocene-like state to an alternate state . aesorng again to a metaphor, think of the Earth System as an airplane (Figure 6). It is ying along at a good speed, at a good altude, at the correct angle, and with a manageable load on board. As long as all of these parameters are within the design tolerances, the airplane has a fair margin for errorit has resilience. If an engine fails, the altude allows our airplane to glide to a safe place for an emergency landing. If the nose of the airplane gets too high, there is enough speed so that the airplane will not immediately stall. Each parameter has a point that if crossed will be enough to cause serious trouble on its own (e.g. too much weight, too steep a climb angle, too close to the ground, or moving too slowly). In systems dynamics parlance this resilience of a specic parameter as it relates to one or more controlling factors is called specied resilience.General resilience, on the other hand, is the overall ability of a system to absorb shocks and remain within its current state or “basin of aracon” (more dynamical systems parlance). With a system as complex as the Earth System, the shocks include those from all known factors (e.g. the nine planetary boundaries) as well as novel ones (the proverbial black swans). In a sense, maintaining general resilience is a sort of insurance, a means of hedging our bets. It is an implicit acknowledgement that the problems of the whole Earth System are simply too complex and conngent for sciensts to make denive predicons” about Planetary BoundariesThe Planetary Boundaries framework seeks to dene safe limits for human impact on key Earth System processes that will keep us from crossing the thresholds of pping points and to help us maintain the overall resilience of the Earth eystem. The roughly 50 sciensts of the etockholm aesilience Centre come from 19 organizaons around the world and have published their work to, lay the groundwork for shiing our approach to governance and management . . . toward the esmaon of the safe space for human development. Planetary boundaries dene, as it were, the boundaries of the ‘planetary playing eld’ for humanity if we want to be sure of avoiding major human-induced environmental change on a global scale . They propose that boundaries be set at the lower limit of the zone of uncertainty for key Earth System processes. Going beyond this line would take us into the zone of uncertainty where surprises in the state of one of the key Earth System processes could push us over a threshold to an abrupt change in the whole Earth system. Staying within these limits, on the other hand, should ensure connued stability of Holocene-like condions for thousands of years onfortunately, sciensts at the etockholm Resilience Centre believe that three of these safe boundaries have already been passed: climate change, rate of biodiversity loss, and changes to the global nitrogen cycle. The climate change boundary established by the group is 350 ppm atmospheric . Concentraons above this “increase the risk of Figure 6: The stability and margin of error that an airplane gets by maintaining proper speed, altude and weight is a sort of general resilience. In a similar way, maintaining the Earth Systems resilience gives it a greater ability to withstand shocks and connue operang in its current Holocene-like state. Paul Friel/Flickr irreversible climate change, such as the loss of major ice sheets, accelerated sea level rise and abrupt shis in forest and agricultural systems. Current atmospheric concentraon has recently reached 400 ppm is rising nearly 20 ppm per decade A second boundary already passed is loss of biodiversity. While it is clear that biodiversity is an important component of ecosystem resilience, the authors suggest that more research is needed to dene a more certain boundary. As a provisional boundary they propose 10 mes the natural rate of exncon. However, they are condent that the current rate of exncon is unsustainable at between 100 to 1natural rate. The third boundary that is esmated to have already been exceeded is for the nitrogen cycle and more generally for the nitrogen and phosphorus cycles. These are important nutrients with central roles in both natural and agricultural producvity. The authors esmate that human acvies currently convert around 120 million tonnes of nitrogen from the atmosphere each year into reacve forms (for ferlizer and from culvaon of leguminous crops) exceeding the conversion by all land based natural processes. An esmated 20 million tonnes of phosphorus is mined for agricultural and industrial use. Much of this agricultural polluon ends up in the environment. Nitrogen pollutes waterways and the coastal zone, accumulang in land systems and adding a number of gases to the atmosphere [and] . . . slowly erodes the resilience of important Earth subsystems As much as 45 per cent of the mined phosphorus ends The Stockholm Alliance acknowledges that their proposed framework is in many ways an extension of past work such as the Limits to Growth systems modeling , the Precauonary Principle , and the Tolerable Windows Approach , to name a few . However, they point out several ways in which the Planetary Boundaries Framework advances from these earlier works . In contrast and perhaps to some degree in response to the cricism of non-specicity of the Eimits to Growth, the Planetary Boundaries framework has idened the specic processes which they believe must be kept within dened safe limits for humanity to operate safely on planet Earth . Also in contrast with the Limits to Growth, the Planetary Boundaries framework recognizes the threat posed by non-linear changes that could result from crossing thresholds Limits to Growth did not foresee this type of abrupt change or non-linear system response The Stockholm Resilience Centre is not the only organizaon addressing environmental limits. Another widely known approach to conceptualizing human pressure on the Earth System is the Global Footprint Network. Its Ecological Footprint is a measure of human impact on the planet. It is expressed as a budget where resources consumed and waste generated are balanced against natures capacity to generate new resources and absorb waste . While it has many similaries to the concept of carrying capacity, Ecological Footprint accounng approaches the queson from a dierent angle. Ecological Footprints are not speculave esmates about a potenal state, but rather are an accounng of the past. Instead of asking how many people could be supported on the planet, the Ecological Footprint asks the queson in reverse and considers only present and past years, using historical data sets (see Box 2). This makes the Ecological Footprint less uncertain Figure 7: The aesilience Centre’s “planetary boundaries” are not clear black lines but rather zones where the risk of reaching a pping point must be avoided. than dynamical systems modeling; however, it avoids that uncertainty by not trying to predict the future. Wherever humanity chooses to look at what might lay ahead there will be uncertainty.The dynamical systems modeling of climate and other natural processes which Meadows and Forester developed and which the Planetary Boundaries approach relies on, includes uncertaines and at best is able to recognize and dene the range and nature of those uncertaines. Nevertheless, by understanding these uncertaines and the appropriate applicaons for models and simulaons we can begin to take a qualied look into the future. Among the greatest values of these models is their ability to explore many ways which the future may unfold and to develop insights into the dynamics which aect that unfolding. Models can help us prepare for those possible futures by tesng various responses to what they suggest and by avoiding responses (or lack of responses) which are indicated to have high risks. Future aole of Technology?One of the greatest sources of uncertainty, and a focus of considerable disagreement, is the development of future technologies. Many, including most mainstream economists, are quite opmisc about human ingenuity and technological advances to overcome challenges posed by populaon growth . According to this view, the invisible hand of the market system will spur any innovaons necessary to substute for natural capital such as land, sources of energy, minerals and . They acknowledge that resources are limited but assume that technology will connue to increase our eciency in ulizing those resources (and in nding substuons) such that producon could keep growing even in the presence of declining mineral resources and other constraints . In the 1970s, one of the key advocates of this point of view, Robert Solow of MIT, stated that, There really is no reason why we should not think of the producvity of natural resources as increasing more or less exponenally over me” eeveral environmental economists nd fault with this blind faith in innovaon and technological development . They contend that mainstream economics tends to ignore the laws of biophysics in its formulaon of producon . In a growth model with environmental constraints, clean technological development needs to be directed and encouraged while “dirty innovaon” should be discouraged . Globally, there are large disparies in capacies to both generate technology and absorb new technologies. Building local capacity must be a central aspect of technological development . Government support is essenal to create naonal systems of innovaon invisible hand is a merely theorecal concept. In reality, markets are regulated by visible hands. Governments have a role to play in designing the legal frameworks within which compeon takes place; seng product standards, taxes and subsidies; and encouraging green technology development. Nevertheless, while many contemporary academic economists accept and address these issues in their work, environmental constraints connue to remain largely absent in the thinking of much of applied economics used in formulang policy Future Demographic Transions?In the past, people have also argued that concerns over world populaon will dissipate as countries undergo the demographic transion. Peak global populaon growth rates of 2.1 per cent occurred in the 1960s followed by a peak in the absolute number of people being added each year at 87 million 25 years later . This slowing in global average populaon growth was the outcome of a dramac drop in birth rates among the world’s most developed countries; many dropping to replacement level or even below . It is very widely accepted that this phenomenon, part of something demographers call the demographic transion, reliably occurs in countries as they become developed (Figure 8) assumpon is incorporated into esmates that project world populaon leveling o just above nine billion by the middle of this century . In general, projecons of future populaon also assume that the economic and social development which is an important dimension of demographic transion, can and will occur in many of the worlds poorer countries This suggests a crucial dilemma for policy makers. The prevailing assumpon about populaon growth rates is that as the developing countries achieve greater development their populaon growth rate will slow (the demographic transion described in Figure 8). This would mean an easing in the number of people pung pressure on the Earth eystem. eo far, so good. However, developed countries also have larger ecological footprints and elevated levels of consumpon. Thus while populaon growth will decline during demographic transion, the reduced number of consumers may have an equally large impact on the Earth System. A further problem is that the steady progress of global GDP, which is taken as evidence that development will eventually reach the enre world, has so far been built on cheap energyprimarily oil.eeveral researchers studying populaon dynamics have begun to queson the inevitability of these development trends connuing and leading most countries through demographic transion . In some countries, populaon growth itself is serious challenge to economic and social development, as an ever-increasing number of employment opportunies and services are needed to meet the needs of the populaon. A further problem is that as the worlds supply of cheap oil declines, increasing energy costs will hinder economic and social development, which are presumed to be important drivers of demographic transion . Researchers warn that large amounts of cheap energy are needed to Demographic Transition Model schematic representationdeathratebirthratetotal population ? high birth rates, high death rates, stable populationdeath rates are lowered,birth rates eventually follow, period of rapidly growing populationbirth rates drop to near death rates, stablizing populationpopulation increase Stage 1 Stage 2 Stage 3 ? Figure 8: Demographic transion has occurred in parallel with (and presumably because of) social and economic development in the world’s most developed countries. Most populaon projecons assume it will occur in many currently developing naons. eource: oNEP-GaID eioux Falls – generalized from mulple sources.Figure 9: Global GDP has risen with global oil producon. The global economic development reected in per capita GDP is linked to lower birth rates and populaon growth by the demographic transion concept. Global Annual Population Growth RateGlobal Oil Production peak oil? projectedpopulationgrowth rate million barrels per dayannual global population growth rate Global Per Capita GDPOil Production, Global Per Capita GDPPopulation Growth Rates projectedpopulationgrowth rate Global Annual Population Growth Rate drive development . The historical reality of the relaonship between per capita energy consumpon and per capita GDP is illustrated in the graph above. As we reach (or have reached) peak oil , there is good reason to queson the sustainability of the current trend of rising global per capita GDP, barring the emergence of a cheap and abundant alternave energy source All of this suggests that demographic transion may not be inevitable and that populaon growth and the queson of carrying capacity may sll be important concerns. Complacent reliance on demographic transion, however polically acceptable it might be, is highly problemac. The current populaon is believed by many to overshoot the Earths capacity to sustainably support it already . To bring developing countries up to consumpon levels of developed countries—and thereby trigger demographic transion—would magnify per capita impact on top of an increasing number of consumers. Predicon is Dicult, Especially About the Future Certainty about what the future will bring is beyond the reach of dynamical systems modeling or economics. With the excepon of fortune tellers, most people accept that predicons all fall along a connuum between guesses and educated guesses. Perhaps then the best that can be hoped for is to make well educated guesses and to understand that that is what they are. History teaches us that predicons are uncertain and that they become increasingly so the further into the future they are made. Perhaps just as importantly, soluons extending forward to those predicted futures are uncertain as well. Comming to those uncertain soluons oen requires trade os and sacrices between haves and have-nots, between current and future generaons. As the highly respected ecologist Edward O. Wilson, pointed out, “The human brain evidently evolved to commit itself emoonally only to a small piece of geography, a limited band of kinsmen, and two or three generaons into the future . . . We are innately inclined to ignore any distant possibility not yet requiring examinaon” A strategy to overcome paralysis that can prevent addressing long-term problems has been suggested by the analysis of an economist, a physicist, and a computer scienst at the aand Corporaon . Referring to work by Herbert A Simon, Popper suggests that rather than choose the soluon which would be opmal under the scenario which we consider to be most likely, most human beings tend to choose soluons which will be sub-opmal but acceptable under several conceivable scenarios. Popper and colleagues suggest applying this insight as we try to arrive at praccal soluons to environmental problems . Each side in this argument has commied to a paradigm which at least in broad terms predicts a distant future. Concomitant with that paradigm is an implied range of soluons which are opmal for the respecve paradigm’s accepted scenarios of the future, but which take no account of the outcome under the countervailing scenario. Ironically the more detailed (and thus aconable) these predicons are the more likely that they will be wrong. The uncertainty of each paradigm’s projected future and the polical diculty of comming to either “all-in” soluon paralyzes policy makers and as a consequence the worlds long-term threats oen get ignored altogether or are even made worse by shortsighted decisions . Popper and his colleagues suggest a strategy which they say beer suits real-world uncertainty. They suggest a robust decision making strategy which seeks the soluon that will stand up under most imaginable scenarios, even if it is not the ideal soluon under any single scenario. In their own words:Tradional predict-then-act methods treat the computer as a gloried calculator. Analysts select the model and specify the assumpons; the computer then calculates the opmal strategy implied by these inputs. In contrast, for robust decision making the computer is integral to the reasoning process. It stress-tests candidate strategies, searching for plausible scenarios that could defeat them. No strategy is completely immune to uncertainty, but the computer helps decision makers exploit whatever informaon they do have to make choices that can endure a wide range of trends Experience tells us there is a good chance that most predicons about the future will be wrong. However, choosing policy that is robust for all of the plausible scenarios we can imagine may oer our best chance of making decisions that can meet the challenges presented by what actually comes to pass Can We Work It Out?In summary, it could be said that soluons from three dierent paradigms have been put forward to resolve the collision of populaon growth with resource limitaons (11). Mathemacian and author Aoel Cohen characterized them as follows:1) “a bigger pie” This is the technological soluons approach, which nds alternave sources of energy and materials and greater 11 eciencies to provide for a larger number people on Earth.2) “fewer forks” This approach is based on the demographic transion, the slowing or stopping of populaon growth to have fewer people dividing the metaphorical pie. 3) “beer manners” This approach is to raonalize and improve the connecon between the decisions and acons taken by people and the consequences of those acons, so we remain within key planetary boundaries. This approach includes such things as dening property rights to open-access resources, eliminaon of economic irraonalies, improving governance and perhaps even imposing some of the externalized costs of having children on the people making the decision to have more children, to create a downward bias on the decision Cohen suggests that none of the soluons are adequate in themselves and that likely all of them must be a part of any sort of sustainable future. To arrive at pragmac “robust decision” strategies, we should test soluons against the range of scenarios and nd ones that would be well suited to several possible futures. For example, among the many factors which drive demographic transion, increased educaon, parcularly for young girls, is a strategy that seems to be robust across all three paradigms of the resources/populaon issue. The “bigger pie” paradigm, which counts on innovaon and technology, would presumably be agreeable to educang future innovators. The “fewer forks” paradigm, which seeks to limit populaon, would be on board because of the established associaon between increased levels of educaon and lowered birth rates. The “beer manners” paradigm (or some poron of it) would likely be open to schooling for children in developing countries that would presumably be accomplished by and contribute to a more equitable distribuon of global resources while encouraging a lower birthrate. Pragmac strategies such as Popperss robust decision making approach may allow us to make decisions thatwhile not ideal for any one future scenariowill yield an acceptable outcome regardless of which predicons about the future are closest to correct. In fact, it may be the case that most approaches to slowing populaon growth are well suited to pragmac compromises, acceptable among the three pie sharing paradigms. Cohen summarizes the six principal approaches to slowing populaon growth as: “promong contracepves, developing economies, saving children, empowering women, educang men, and doing everything at once . These approaches would seem to oer many opportunies for acon that could meet a variety of goals and be acceptable to a range of possible futures. As Oxford economist Robert Cassen says, “Virtually everything that needs doing from a populaon point of view needs doing anyway . Perhaps in the end, reconciling the paradigms is not as important as accepng the limits of our ability to predict the future with certainty, and then making robust, pragmac decisions that will hold up under a variety of futures. Adopng a more humble idea of our ability to predict the future, we can sll work to build and maintain resilient natural and social systems well suited to whatever the future brings. eo, One Planet, How Many People?The human footprint has grown to such a scale that it has become a major geophysical force. While there are many ways we might reduce our per capita footprint on the planet, the collecve impact of those footprints will always be mulplied by global populaon. This makes populaon an issue which cannot be ignored. While there is an incredible range to the esmates of Earth’s carrying capacity, the greatest concentraon of esmates falls between 8 and 16 billion people populaon is fast approaching the low end of that range and is expected to get well into it at around 10 billion by the end of the century. Many of us alive today will be alive when the planet is carrying (or not carrying) nine epeculaon about global populaon and carrying capacity has existed since at least the 17th century. This century has seen the establishment of the UN Economic and eocial Council Populaon Commission, established in 1946, and the creaon of the World Populaon Plan of Acon . Dennis Meadows and his Figure 10: How do we share the “pie”? colleagues at Massachuses Instute of Technology sparked discussion about the nite nature of the planet’s resources . Crics accused the authors of “Malthusian reasoning, failing to allow for the social and economic feedback mechanisms that could overcome scarcity and environmental constraints . Polarized debates connued unl the Brundtland aeport, Our Common Future, argued that environment and development were linked eo where do we go from here? eciensts and policy-makers are working together to develop reducon targets for pollutants to our air, water, and soil to keep our planet below crical pping points. However, these internaonal policies need to be combined with implementable soluons at regional, local, and individual scales . Connued monitoring of changes in bioc communies and reducon of per capita human impact are needed to avert current trajectories . The plausibility of a planetary-scale ‘pping point’ highlights the need to improve biological forecasng by detecng early warning signs of crical transions on global as well as local scales, and by detecng feedbacks that promote such transions” . Future projecons from current trends might not account for threshold-induced state shis due to human-induced forcings Today, in 2012, a variety of things are clear: 1) Populaon growth remains a major concern for future well-being. There are many who feel that if humankind cannot limit the number of people weighing on the Earth System on humanitys terms, then the Earth System itself will set that limit on its own terms aaising the issue of populaon limits directly, however, is oen met with cricism and concern that any policy directly aimed at reducing populaon may be coercive and unfair . Not only are there signicant polical barriers to addressing human populaon control directly, but according to some it may even be counterproducve . However, even among those who argue that a direct approach to populaon does not belong in the environmental policy discussion , there is general acknowledgment that, “stabilizing the global populaon is, and will remain, necessary 2) Material consumpon is a major concern.are consuming resources and producing waste at a greater scale than ever before and per capita consumpon levels are projected to increase with connued development. As reported by the aoyal Society (2012), “Populaon and consumpon are both important: what maers is the combinaon of increasing populaon and increasing per capita consumpon.” They also recommend developing socio-economic systems and instuons that are not dependent on connued material consumpon growth” 3) Demography is not desny. variant projecon is 9.3 billion people by mid century, high and low variant projecons, based on plausible scenarios, are 10.6 billion and 8.1 billion. Future trends depend on todays policies.4) We must all play a role in nding human-centered, rights-based policies: These policies must “respecully the principles agreed upon at the 1992 onited Naons Conference on Environment and Development (oNCED) and, parcularly, the principle of common but dierenated responsibilies.” 5) This requires a three-pronged approach: Developed countries have to take the lead in changing their producon and consumpon paerns. Developing countries should maintain their development goals but do so while adopng sustainable pracces and slowing populaon growth. Developed countries should commit to enable and support the developing countries sustainable development through nance, technology transfer and appropriate reforms to the global economic and nancial structures.6) We cannot simply rely on technological innovaon (the “bigger pie”) and demographic transion (“fewer forks”) to eliminate or solve the populaon problem:However, technological innovaon and the demographic transion, when supported by the disseminaon of green technologies and the creaon of green economies, can help achieve a sustainable future. Acve development strategies must be put in place to drive the transformaon towards new dynamic green acvies.7) We have exisng methods that have proven to be eecve sustainable development tools:include providing access to sexual and reproducve healthcare and contracepon; investment in educaon beyond the primary level for all genders; empowering women to parcipate in economic, social and polical life; and reducing infant mortality. These measures enable families to beer decide on the number, ming and spacing of children. Demographic change is the result of individual choices and opportunies, and best addressed by enlarging, not restricng, these choices 8) We also have new tools and beer models that can be used to help us develop policies: However, in order to become eecve and implementable soluons, these models need to be further rened and elaborated. Addional research is needed. 000 Tonnes of Grass x 7 Billion PeopleThree hundred trout are needed to support one man for a year. The trout, in turn, must consume 000 frogs, that must consume 27 million 000 tons of grass. — G. Tyler Miller, Ar., American Chemist (1971)Net Primary Producon (NPP) is one way of measuring that grass. eciencally speaking, NPP is the amount plant material produced on Earththe net amount of solar energy converted to plant organic maer through photosynthesis. It is the primary fuel for Earths food web, and in terms of carbon can be measured via the photosynthesis process (i.e. CO exchange between atmosphere and biosphere). The NPP has been called the common currency for climate change, ecological, and economic assessments. The rate at which humans consume NPP is a powerful aggregate measure of human impact on biosphere funcon.Various studies have esmated that humans now appropriate between 24 and 32 percent of global NPP for our own use . That means less NPP is available in the form of grass and other vegetaon at the boom of the food web, but it also changes the composion of the atmosphere, the level of biodiversity, and alters the provision of important ecosystem services The term Anthropoocene refers to the scale of human impact on all of the processes of the Earth eystem. Human Appropriaon of Net Primary Producon is a measure of human impact on the biosphere in parcular. That humans now appropriate between roughly one-quarter to one-third of all NPP is further evidence of the size of the human footprint on Earth. The map shows the percentage of NPP being appropriated as a percentage of local NPP. In other words it shows the local budget of NPPavailable NPP minus NPP appropriated. eome areas with lile NPP to appropriate (such as Saudi Arabia) and other areas with many people to do the appropriang (such as India) have areas of incredible decits of 200 to 400 percent of the local NPP. Presumably, areas of ongoing decit will increasingly rely on eecvely imporng NPP in the form of food, ber and materials from areas which are not in decit. While the ulmate ceiling of total global NPP has not been reached, the impact of localized decits are transmied to the rest of the globe by these economic connecons. In addion, the reduced resiliency in areas of decit (for example a reduced ability to withstand a season of drought) reduce global resiliency. Human Appropriation of NPP 0 0 - 20 percent 20 - 40 percent 40 - 60 percent 60 - 80 percent 80 - 100 percent 100 - 200 percent 200 - 400 percent 400 - 1,000 percent 1,000 - 40,000 percent Imhoff, M.L., Bounoua, L., Ricketts, T., Loucks, C., Harriss, R., and Lawrence, W.T. (2004) Box 1 Ecological FootprintConceived in 1990 by Mathis Wackernagel and William aees at the oniversity of Brish Columbia, the Ecological Footprint is a widely used measure of the demands being made on nature by human acvies. It measures how much land and water area a human populaon requires to produce the resources it consumes and to absorb its carbon dioxide emissions, based on current technology. This central idea of footprint science is in some respects similar to carrying capacity. However, carrying capacity esmates require assumpons about future per-person resource consumpon, standards of living and “wants” (as disnct from “needs”), producvity of the biosphere, and advances in technology. An Box 2 Instut Escola Ees VinyesThe ecological creditor and debtor map for 2007 compares the Ecological Footprint of consumpon with domesc biocapacity. eource: Ewing and others 2010 15 areas carrying capacity for humans is thus inherently speculave and dicult to dene.Ecological Footprint accounng approaches the carrying capacity queson from a dierent angle. Ecological Footprints are not speculave esmates about a potenal state, but rather are an accounng of the past. Instead of asking how many people could be supported on the planet, the Ecological Footprint asks the queson in reverse and considers only present and past years. The Footprint asks how many planets were necessary to support all of the people that lived on the planet in a given year, under that year’s standard of living, biological producon and technology. This is a scienc research and accounng queson that footprint science approaches through the analysis of documented, historical data sets. Also the challenge lies in the Ecological Footprints reliance on ecosystem funcons, which, aside from varying spaally, are in a state of connual change with respect to their capacies due to variaons in (and interacons with) land use, weather and climate. A key concept of footprint science is ecological overshoot. This occurs when humanity turns resources into waste faster than waste can be turned back into resources. Overshoot may not be immediately apparent because we are able to ulize resources accumulated over me (or imported from elsewhere in the case of local ecological footprints). For example, fossil fuels which took hundreds of millions of years to form are being ulized at rates far beyond the Earth Systems capacity to replace them. According to Wackernagel and colleagues, humanity uses the equivalent of 1.5 planets to provide the resources we use and absorb our waste. This means it now takes the Earth one year and six months to regenerate what we use in a year. This rate of overshoot is an average for the whole globe and hides the fact that some countries are in serious overshoot while some others sll have surplus biocapacity. Adapted from Footprint Network hp://www.footprintnetwork.org/en/index.php/GFN/ Accessed: 8 Aune 2012. NAeA aeferences: 1. Adlaitoday (no date) Adlai Today Adlai Quotes Accessed April 9, 2012 at: hp://www.adlaitoday.org/ideas/quotes_connect.html2. oe Census Bureau (2011) o.e. Census Bureau, Internaonal Data Base Accessed April 19, 2011 at: hp://www.census.gov/ipc/www/idb/worldpopinfo.php3. Cohen, A. E. (2003). Human populaon: the next half century. [aesearch eupport, o.e. Gov’t, Non-P.H.e.]. ecience, 302(5648), 1172-1175. doi: 10.1126/science.10886654. Crutzen, P.J. (2002) Geology of mankind. Nature 415:23.5. eteen, W., Persson, Å., Deutsch, E., Zalasiewicz, A., Williams, M., Richardson, K., . . . Svedin, U. (2011). The Anthropocene: From Global Change to Planetary etewardship. Ambio, 40(7), 739-761. doi: 10.1007/s13280-011-0185-x6. oNPD (2010) World Populaon Prospects, 2010 aevision. onited Naons Populaon Divisions. Accessed May 10, 2011 at: hp://esa.un.org/unpd/wpp/unpp/panel_populaon.htm7. World Bank (2011) World Development Indicators & Global Development Finance. Accessed April 20, 2011 at: hp://data.worldbank.org/data-catalog/worlddevelopment-Indicators8. oNPD (2011) onited Naons, Department of Economic and eocial Aairs, Populaon Division (2011). World Populaon Prospects: The 2010 aevision, CD-aOM Edion. Accessed April 9, 2012 at: hp://esa.un.org/unpd/wpp/Excel-Data/mortality.htm9. Ewing, B., aeed, A., Galli, A., Citzes, A. and Wackernagel, M. (2010) Calculaon Methodology for the Naonal Footprint Accounts, 2010 Edion. Oakland: Global Footprint Network.10. UNEP (2011) Decoupling natural resource use and environmental impacts from economic growth, A aeport of the Working Group on Decoupling to the Internaonal aesource Panel. Fischer-Cowalski, M., ewilling, M., von Weizsäcker, E.o., aen, Y., Moriguchi, Y., Crane, W., Krausmann, F., Eisenmenger, N., Giljum, S., Hennicke, P., Romero Lankao, P., Siriban Manalang, A.11. Cohen, A. E. (1995a). Populaon growth and earth’s human carrying capacity. ecience, 269(5222), 341-346. doi: 10.1126/science.761810012. Van Den Bergh, A. C. A. M., & aietveld, P. (2004). aeconsidering the Eimits to World Populaon: Meta-analysis and Meta-predicon. .p]2.0.co;213. Cohen, A. E. (1995b) How Many People Can the Earth eupport? : W.W. Norton.14. Bardi, o. (2011) The Eimits to Growth aevisited. epringer, New York. 15. Schoijet, M. (1999). Limits To Growth And The Rise Of Catastrophism. Environmental History, 4(4), 515-530.16. Hall, C. A. e. and Clitgaard, C. A. (2012). Are There Eimits to Growth? Examining the EvidenceEnergy and the Wealth of Naons (pp. 207-220): epringer New York.17. eimmons, M. a. (2000). aevising The Eimits to Growth Could The Club of aome Have Been Correct, Aer All? An Energy White Paper. aetrieved from hp://greatchange.org/ov-simmons,club_of_rome_revisted.html18. Brown, L. R. (2005). Outgrowing the Earth: the food security challenge in an age of falling water tables and rising temperatures: Earthscan.19. Turner, G. M. (2008). A comparison of The Limits to Growth with 30 years of reality. Global Environmental Change, 18(3), 397-411. doi: 10.1016/j.gloenvcha.2008.05.00120. IPCC (2007) The Physical ecience Basis. Contribuon of Working Group I to the Fourth Assessment Report of the Intergovernmental Panel on Climate Change, ed. e. eolomon, D. Qin, M. Manning, Z. Chen, M. Marquis, C. Averyt, M.M.B Tignor, H.E. Miller Ar, and Z. Chen. 996 pp. Cambridge, UK: Cambridge University Press. 21. MEA (2005) Ecosystems and Human Well-being: General eynthesis. Accessed April 9, 2012 at: hp://maweb.org/en/index.aspx22. aockstrom, A., eteen, W., Noone, C., Persson, A., Chapin, F. e., Eambin, E. F., . . . Foley, A. A. (2009b). A safe operang space for humanity. [10.1038/461472a]. Nature, 461(7263), 472-475.23. aockström, A., W. eteen, C. Noone, Å. Persson, F. e. Chapin, III, E. Eambin, T. M. Eenton, M. echeer, C. Folke, H. echellnhuber, B. Nykvist, C. A. De Wit, T. Hughes, e. van der Eeeuw, H. aodhe, e. eörlin, P. C. enyder, a. Costanza, o. evedin, M. Falkenmark, E. Carlberg, a. W. Corell, V. A. Fabry, A. Hansen, B. Walker, D. Eiverman, C. aichardson, P. Crutzen, and A. Foley (2009a) Planetary boundaries:exploring the safe operang space for humanity. Ecology and eociety 14(2): 32. [online] oaE: hp://www.ecologyandsociety.org/vol14/iss2/art32/24. Folke, C., Carpenter, e., Walker, B., echeer, M., Chapin, T., and aockstrom, A. (2010). aesilience Thinking: Integrang aesilience, Adaptability and Transformability. Ecology and Society, 15(4), 20.25. Popper, e.W., Eempert, a.A. and Bankes, e.C. (2005) ehaping the Future. ecienc American 292(4), 66-71.26. NOAA (2012) Carbon dioxide levels reach milestone at Arcc sites: NOAA cooperave measurements in remote, northern sites hit greenhouse gas milestone in April. Accessed Aune 12, 2012 at: hp://researchmaers.noaa.gov/news/Pages/arccCO2.aspx27. NOAA (2011) NOAA/EeaE calculaon of global means, NOAA, Earth System Research Laboratory, Global Monitoring Division. Accessed April 9, 2012 at: hp://www.esrl.noaa.gov/gmd/ccgg/about/global_means.html28. Meadows, D., Meadows, D., aanders, A. and Behrens, W. (1972). “The Eimits to Growth”. New York: Potomac29. Kriebel, D., Tickner, J.A., Epstein, P., Lemons, J., Levins, R., Loechler, E.E., Quinn, M., audel, a., echeler, T. and etoto, M. (2001) The Precauonary Principle in Environmental ecience. Environmental Health Perspecves 109:871-876.30. German Advisory Council on Global Change (WBGo) (1995) ecenario for the Derivaon of GlobalCO2 aeducon Targets and Implementaon etrategies, Bremerhaven.31. Stern, D. I. (2011). The Role of Energy in Economic Growth. Annals of the New Yourk Academy of eciences 1219, 26-51 (working paper version).32. eolow, a. M. (1973). Is the End of the World at Hand? Challenge, 16(1), 33. Daily, G. C., & Ehrlich, P. a. (1992). Populaon, eustainability, and Earth’s Carrying Capacity. Bioecience, 42(10), 761-771.34. aeijnders, E. (1998). The Factor X Debate: eeng Targets for Eco-Eciency. Aournal of Industrial Ecology, 2(1), 13-22. doi: 10.1162/Writers: Bruce PengraReviewers: Zinta Zommers, Marc Imho and Michelle A. LuebkeProducon and Outreach Team: Arshia Chander, Erick Litswa, Michelle Anthony, Reza Hussain, Theuri Mwangi UNEP GRID Sioux Falls, UNEP GRID Nairobi, UNFPA, NASA/GSFC, UNEP RONA)Acknowledgment: 35. Hall, C., Eindenberger, D., CtMmel, a., Croeger, T., & Eichhorn, W. (2001). The Need to Reintegrate the Natural Sciences with Economics. tn]2.0.co;236. Aghion, P., Acemoglu, D., Bursztyn, L. and Hemous D. (2011) The Environment and Directed Technical Change. GaAeP Working Paper 21. Accessed April 30, 2012 at: hp://www.economics.harvard.edu/faculty/aghion/les/Environment%20and%20Directed.pdf37. Ocampo, A.A. (2012) The Transion to a Green Economy: Benets, Challenges and aisks from a eustainable Development Perspecve. Summary of Background Papers. UN-DESA, UNEP, UN Conference on Trade and Development.38. Arrow, K., Bolin, B., Costanza, R., Dasgupta, P., Folke, C., Holling, C. e., Aansson, B.O., Eevin, e., Mäler, C. G., Perrings, C., and Pimentel, D. (1995). Economic growth, carrying capacity, and the environment. Science 39. Bongaarts, A. (2009). Human populaon growth and the demographic transion. [Historical Arcle]. Philos Trans a eoc Eond B Biol eci, 364(1532), 2985-2990. doi: 10.1098/rstb.2009.013740. DeEong, A. P., Burger, O., & Hamilton, M. A. (2010). Current demographics suggest future energy supplies will be inadequate to slow human populaon growth. [aesearch eupport, o.e. Gov’t, Non-P.H.e.]. 41. Myrskyla, M., Cohler, H. P., & Billari, F. C. (2009). Advances in development reverse ferlity declines. [Historical Arcle aesearch eupport, Non-o.e. Gov’t]. Nature, 460(7256), 741-743. doi: 10.1038/nature0823042. Tuljapurkar, S. (2009) Demography: Babies make a comeback. Nature 43. Luci, A. and Thévenon, O. (2010) Does economic development drive the ferlity rebound in OECD countries? INED working paper 167. Accessed April 19, 2011 at: hp://www.ined.fr/chier/t_publicaon/1514/publi_pdf1_dt_167.pdf44. Valenne, e. V. (2010). Disarming the populaon bomb. Internaonal Aournal of eustainable Development & World Ecology, 17(2), 120-132. doi: 45. Murphy, D. J. and Hall, C. A. S. (2011). Energy return on investment, peak oil, and the end of economic growth. Annals of the New York Academy of eciences, 1219(1), 52-72. doi: 10.1111/j.1749 46. Hall, C. A. e. and Day, A. W. (2009). aevising the Eimits to Growth Aer Peak Oil. American ecienst, 97(3).47. Brown, A. H., Burnside, W. a., Davidson, A. D., DeEong, A. P., Dunn, W. C., Hamilton, M. A., . . . Zuo, W. (2011). Energec Eimits to Economic Growth. Bioecience, 61(1), 19-26. doi: 10.1525/bio.2011.61.1.748. Nel, W. P., & van Zyl, G. (2010). Dening limits: Energy constrained economic growth. Applied Energy, 87(1), 168-177. doi: 10.1016/j.apenergy.2009.06.00349. Campbell, C. Eaherrére, A. (1998). The End of Cheap Oil. ecienc American, 3, 78-83.50. Wilson, E.O. (2002) The Future of Eife. Alfred A. Cnopf 200251. WPPA (1974). World Populaon Plan of Acon (WPPA). First World PopulaonConference: Bucharest, 19 – 30 August 1974.52. Beckerman W. (1972). Economists, sciensts and environmental catastrophe. Oxford Economic Papers, 24, 327 – 344.53. Simon J and Kahn H eds. (1984). The resourceful Earth: a response to the global 2000 report. Basil Blackwell: New York.54. World Commission on Environment and Development (1987) Our Common Future. Oxford University Press55. DeFries, R., E. Ellis, F. S. Chapin III, P. Matson, B. L. Turner II, Arun Agrawal, P. Crutzen, C. Field, P. Gleick, P. Kareiva, E. Lambin, E. Ostrom, P. Sanchez, J. Syvitski, and D. Liverman. (2012, In press). Planetary Opportunies: A eocial Contract for Global Change ecience to Contribute to a eustainable Future. Bioecience 62(6), xxx-xxx. hp://www.jstor.org/stable/10.1525/bio.2012.62.issue-656. D. Barnosky, A. D., Hadly, E. A., Bascompte, J., Berlow, E. L., Brown, A. H., Fortelius, M., Getz, W.M., Harte, A., Hasngs, A., Marquet, P. A., Marnez, N. D., Mooers, A., aoopnarine, P., Vermeij, G., Williams, A. W., Gillespie, R., Kitzes, J., Marshall, C., Matzke, N., Mindell, D. P., Revilla, E., and A. B. emith (2012) Approaching a state shi in Earth’s biosphere. Nature, 486, 5258. doi:10.1038/nature1101857. Bartle, A.A. (1997–98) ‘aeecons on sustainability, populaon growth, and the environment revisited, Renewable Resources Journal 58. Pimentel, D., Whitecra, M., eco, Z. a., Zhao, E., eatkiewicz, P., eco, T. A., Moe, T. E. (2010). Will Eimited Eand, Water, and Energy Control Human Populaon Numbers in the Future? Human Ecology, 38(5), 599-611. doi: 10.1007/s10745-010-9346-y59. een, A. (1994). Populaon: Delusion and aeality. New York aeview of Books, 41(15).60. Connelly, M. (2008) Fatal Misconcepon: The etruggle to Control World Populaon, Belknap Press of Harvard oniversity Press, Cambridge, 61. Mosher, e.W. (2008) Populaon Control: aeal Costs, Illusory Benets. Transacon Publishers, New Brunswick, NA.62. Boersema, A. (2011). Does the populaon issue sll have a valid place on the environmental agenda? Aournal of Integrave Environmental 63. Royal Society (2012) People and the planet. The Royal Society Policy Centre Report 1/12. London.64. Miller, G.T. (1971) quoted at The Flow of Energy: Higher Trophic Eevels, oniversity of Michigan “Globalchange” website: hp://www.globalchange.umich.edu/globalchange1/current/lectures/kling/energyow/highertrophic/trophic2.html65. Haberl, H., Erb, K. H., Krausmann, F., Gaube, V., Bondeau, A., Plutzar, C., Gingrich, e., Eucht, W., and M. Fischer-Cowalski. (2007). Quanfying and mapping the human appropriaon of net primary producon in earth’s terrestrial ecosystems. Proc. Natl. Acad. eci., 104(31), 12942-12947.66. aojstaczer, e., eterling, e. M., & Moore, N. A. (2001). Human Appropriaon of Photosynthesis Products. ecience, 294(5551), 2549-2552. doi: 10.1126/science.106437567. Vitousek, P. M., Ehrlich, P. a., Ehrlich, A. H., & Matson, P. A. (1986). Human Appropriaon of the Products of Photosynthesis. Bioecience, 36(6), 68. Imho, M. E., Bounoua, E., aickes, T., Eoucks, C., Harriss, a., & Eawrence, W. T. (2004). Global paerns in human consumpon of net primary producon. [10.1038/nature02619]. Nature, 429(6994), 870-873.Informaon is regularly scanned, screened, ltered, carefully edited, and published for educaonal purposes. oNEP does not accept any liability or responsibility for the accuracy, completeness, or any other quality of informaon and data published or linked to the site. Please read our privacy policy and disclaimer for further informaon.