PPT-23-Late Adulthood - Biosocial
Author : cheryl-pisano | Published Date : 2018-02-02
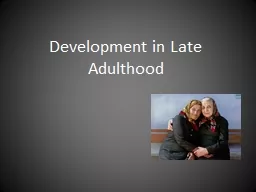
Age 65 until the end Roman lives in the United States where there is an increasing elderly population As a result if we graphed the population by age and the number
Presentation Embed Code
Download Presentation
Download Presentation The PPT/PDF document "23-Late Adulthood - Biosocial" is the property of its rightful owner. Permission is granted to download and print the materials on this website for personal, non-commercial use only, and to display it on your personal computer provided you do not modify the materials and that you retain all copyright notices contained in the materials. By downloading content from our website, you accept the terms of this agreement.
23-Late Adulthood - Biosocial: Transcript
Download Rules Of Document
"23-Late Adulthood - Biosocial"The content belongs to its owner. You may download and print it for personal use, without modification, and keep all copyright notices. By downloading, you agree to these terms.
Related Documents