PPT-9.6.2015
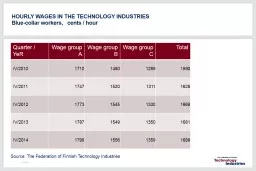
1 Quarter YeR Wage group A Wage group B Wage group C Total iV2010 1710 1480 1289 1590 IV2011 1747 1520 1311 1628 IV2012 1773 1545 1330 1669 IV2013
Download Presentation
"9.6.2015" is the property of its rightful owner. Permission is granted to download and print materials on this website for personal, non-commercial use only, provided you retain all copyright notices. By downloading content from our website, you accept the terms of this agreement.
Presentation Transcript
Transcript not available.