/
BLUE CROSS AND BLUE SHIELD OF MONTANA BLUE CROSS AND BLUE SHIELD OF MONTANA

BLUE CROSS AND BLUE SHIELD OF MONTANA - PowerPoint Presentation

cheryl-pisano
cheryl-pisano . @cheryl-pisano
Follow
346 views
Uploaded On 2019-06-21

BLUE CROSS AND BLUE SHIELD OF MONTANA - PPT Presentation

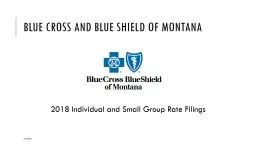
2018 Individual and Small Group Rate Filings 7242017 Product Portfolio Retail 7242017 2 Category Metal 2017 2018 Number of Plans Platinum 0 0 Gold 3 2 Silver 5 3 Bronze 5 ID: 759537

2017 final rates rate final 2017 rate rates change filing 2018 prior deadline initial proposed subject tax 000 500 load group 100

Share:

Link:

Embed:

Download Presentation from below link

Download Presentation The PPT/PDF document "BLUE CROSS AND BLUE SHIELD OF MONTANA" is the property of its rightful owner. Permission is granted to download and print the materials on this web site for personal, non-commercial use only, and to display it on your personal computer provided you do not modify the materials and that you retain all copyright notices contained in the materials. By downloading content from our website, you accept the terms of this agreement.


Presentation Transcript

Slide1

BLUE CROSS AND BLUE SHIELD OF MONTANA

2018 Individual and Small Group Rate Filings

7/24/2017

Slide2

Product PortfolioRetail

7/24/2017

2

CategoryMetal20172018Number of PlansPlatinum00Gold32Silver53Bronze53Catastrophic11Range of Individual DeductiblesPlatinumNot AvailableNot AvailableGold$500 - $1,650$0 - $450Silver$2,500 - $3,850$1,000 - $3,500Bronze$5,000 - $6,500$2,700 - $4,000Catastrophic$7,150 $7,350 Range of Individual Out-of-Pocket Maximums (Including Deductibles)PlatinumNot AvailableNot AvailableGold$3,350 - $5,250$7,350 Silver$4,500 - $7,150$7,350 Bronze$6,500 - $7,150$6,550 - $7,350Catastrophic$7,150 $7,350 Range of General CoinsurancePlatinumNot AvailableNot AvailableGold70% - 80%60% - 70%Silver70% - 80%50% - 70%Bronze60% - 100%50% - 70%Catastrophic100%100%

The networks being offered and the rating areas in which they are available have not changed from 2017 to 2018.

Initial proposed rates are not final. Subject to change prior to final rate filing deadline.

Slide3

2018 Increases by Metallic Level, by Rating Area, & By Network Retail

Initial proposed rates are not final. Subject to change prior to final rate filing deadline.

7/24/2017

3

Metallic LevelBlue PreferredBlue Focus POSCatastrophic31.1%N/ABronze23.6%13.5%Silver25.3%19.8%Gold14.6%14.4%

Rating Area

Blue Preferred

Blue Focus POS

1: Billings

18.7%

17.5%

2: Great Falls

24.1%

N/A

3: Missoula

22.6%

17.3%

4: Non MSA

24.7%

N/A

Slide4

Sources of 2018 ChangeRetail

The Impact of Medicaid Expansion was estimated to be a 6.6% decrease in market average risk between the 2015 experience period and the 2017 projection period when developing the 2017 rates.No adjustment was made to the 2018 rates for the Impact of Medicaid Expansion in addition to what was already built into the 2017 rates.

 ImpactTrend9.6%Market Stabilization Rule-1.4%2017 Rate Sufficiency-6.0%2018 Risk Deterioration0.8%Miscellaneous-0.1%  Average Increase Before ACA Provisions2.3%  ACA Provisions (CSR/Mandate/Etc)17.3%Insurer Fee2.6%  Average Rate Increase23.1%

7/24/2017

Initial proposed rates are not final. Subject to change prior to final rate filing deadline.

4

Slide5

Administrative Expense LoadRetail

7/24/2017

5

20172018Administrative Expense Load as a Percentage9.2%7.0%Administrative Expense Load as a PMPM Dollar Amount$56.09$47.24

Initial proposed rates are not final. Subject to change prior to final rate filing deadline.

Slide6

Contribution to RESERVESRetail

7/24/2017

6

Reserves Load (Pre-Tax) as a Percentage6.9%Reserves Load (Pre-Tax) as a PMPM Dollar Amount$46.83Reserves Load (Post-Tax) as a Percentage5.5%Reserves Load (Post-Tax) as a PMPM Dollar Amount$37.47

Initial proposed rates are not final. Subject to change prior to final rate filing deadline.

Slide7

Membership ProjectionsRetail

7/24/2017

7

Initial proposed rates are not final. Subject to change prior to final rate filing deadline.

The 2018 membership projection is variable, depending on certain factors such as potential regulatory changes, final product pricing and consumers’ purchasing decisions.

Slide8

Product PortfolioSmall Group

7/24/2017

8

CategoryMetal20172018Number of PlansPlatinum22Gold99Silver55Bronze23Range of Individual DeductiblesPlatinum$250 - $750$250 - $750Gold$0 - $4,000$750 - $4,200Silver$2,250 - $3,650$3,000 -$6,500Bronze$5,500 - $6,000$5,500 -$7,350Range of Individual Out-of-Pocket Maximums (Including Deductibles)Platinum$1,250 - $1,500$1,250 - $1,500Gold$2,000 - $6,850$2,000 - $4,700Silver$3,650 - $7,000$3,700 - $7,350Bronze$6,450 - $6,550$6,450 - $7,350Range of General CoinsurancePlatinum80%80%Gold50% - 100%50% - 100%Silver70% - 100%70% - 100%Bronze70% - 80%70% - 100%

The networks being offered and the rating areas in which they are available have not changed from 2017 to 2018.

Initial proposed rates are not final. Subject to change prior to final rate filing deadline.

Slide9

2018 Quarterly Increases by Metallic Level and by Rating Area Small Group

Rating AreaQ1Q2Q3Q41: Billings1.6%0.6%-0.4%6.7%2: Great Falls4.8%3.8%2.7%10.2%3: Missoula4.4%3.4%2.3%9.7%4: Non MSA5.7%4.6%3.6%11.1%

Metallic LevelQ1Q2Q3Q4Bronze4.7%3.6%2.6%10.0%Silver1.9%0.9%-0.1%7.1%Gold5.4%4.3%3.3%10.7%Platinum8.3%7.2%6.1%13.8%

Initial proposed rates are not final. Subject to change prior to final rate filing deadline.

7/24/2017

9

Slide10

Sources of Change 2018Q1Small Group

7/24/2017

10

No adjustment was made to the 2018 rates for the Impact of Medicaid Expansion.

Initial proposed rates are not final. Subject to change prior to final rate filing deadline.


Impact

Trend

9.8%

Market Stabilization Rule

0.0%

2017 Rate Sufficiency

-6.1%

2018 Risk Deterioration

-0.2%

Miscellaneous

-0.8%


Average Increase Before ACA Provisions

2.1%


ACA Provisions (CSR/Mandate/

Etc

)

0.0%

Insurer Fee

2.3%


Average Rate Increase

4.4%

Slide11

Administrative Expense LoadSmall Group

7/24/2017

11

20172018Administrative Expense Load as a Percentage8.03%7.98%Administrative Expense Load as a PMPM Dollar Amount$38.65$38.51

Initial proposed rates are not final. Subject to change prior to final rate filing deadline.

Slide12

Contribution to RESERVESSmall Group

7/24/2017

12

Reserves (Pre-Tax) as a Percentage5.0%Reserves (Pre-Tax) as a PMPM Dollar Amount$24.11Reserves (Post-Tax) as a Percentage4.0%Reserves (Post-Tax) as a PMPM Dollar Amount$19.29

Initial proposed rates are not final. Subject to change prior to final rate filing deadline.

Slide13

Membership ProjectionsSmall Group

7/24/2017

13

2018 Projected Members36,385

Initial proposed rates are not final. Subject to change prior to final rate filing deadline.