PPT-Grassland- shrubland transitions: Part 1
Author : cheryl-pisano | Published Date : 2020-04-04
Previous LTER cycles IIII have focused largely of mechanisms and consequences of shrubland resilience Lateral flux of water sediment nutrients Percolation Schlesinger
Presentation Embed Code
Download Presentation
Download Presentation The PPT/PDF document " Grassland- shrubland transitions: Part..." is the property of its rightful owner. Permission is granted to download and print the materials on this website for personal, non-commercial use only, and to display it on your personal computer provided you do not modify the materials and that you retain all copyright notices contained in the materials. By downloading content from our website, you accept the terms of this agreement.
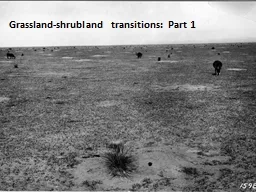
Grassland- shrubland transitions: Part 1: Transcript
Download Rules Of Document
" Grassland- shrubland transitions: Part 1"The content belongs to its owner. You may download and print it for personal use, without modification, and keep all copyright notices. By downloading, you agree to these terms.
Related Documents