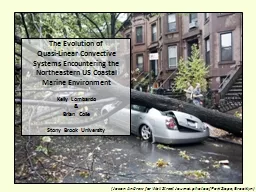
The Evolution of QuasiLinear Convective Systems Encountering the Northeastern US Coastal Marine Environment Kelly Lombardo amp Brian Colle Stony Brook University 31 MAY 2002 1700 UTC 01 JUN 2002 1000 UTC ID: 256989
Download Presentation The PPT/PDF document "(Jason Andrew for Wall Street Journal: p..." is the property of its rightful owner. Permission is granted to download and print the materials on this web site for personal, non-commercial use only, and to display it on your personal computer provided you do not modify the materials and that you retain all copyright notices contained in the materials. By downloading content from our website, you accept the terms of this agreement.
Slide1
(Jason Andrew for Wall Street Journal: photo of Park Slope, Brooklyn)
The Evolution of
Quasi-Linear Convective Systems Encountering the Northeastern US Coastal Marine Environment
Kelly Lombardo
&
Brian Colle
Stony Brook UniversitySlide2
31 MAY 2002 1700 UTC –
01 JUN 2002 1000 UTC
23 JUL 2002 1600 UTC –
24 JUL 2002 0400 UTC
Let’s compare the evolution of 2 different QLCS events…Slide3
31 MAY 2002 1700 UTC –
01 JUN 2002 1000 UTC
23 JUL 2002 1600 UTC –
24 JUL 2002 0400 UTC
Let’s compare the evolution of 2 different QLCS events…
Why does one event survive over the Atlantic
while the other decays upon reaching the coastline?Slide4
Data & Methods: Composites
Manually examined 2-km NOWrad radar reflectivity for 6 warms seasons (May-Aug) 2002-2007; Identified 73 QLCS that encountered the Atlantic coast.
65 QLCS events were classified into 4 different categories based on their evolution encountering the coastline.
32 decaying events
: Decay at the coastline.
18 slowly decaying events
: Show no signs of decay at the coast, but decay over the water within 100 km of the coast.
9 sustaining events
: Maintain their intensity more than 100 km from coastline.
6 organize events
: Organize along the
coastline (
not addressed in this study).
Feature-based composites for decaying,
slowly decaying, and sustaining
events using 32-km NARR data.
Centered on the point where the QLCS crosses the coast at the closest 3-hr NARR time prior to the crossing.
QLCS
0-100 km
>100 kmSlide5
MUCAPE (J kg
-1
), MSLP (hPa), 1000 theta (2 K), 10 m wnd (kts)
Decaying
Sustaining
Decaying
: MUCAPE 1250 J kg
-1
; collocated with a surface pressure trough & 1000 hPa thermal ridge.
Geography for reference only: Star center point for feature based composites.
Sustaining
: MUCAPE 1000 J kg
-1
; surface pressure trough 300 km to west; QLCS collocated with 1000 hPa baroclinic zone.Slide6
Decaying
: MUCIN 15 J kg
-1
and increases rapidly offshore; RH of 68% (lowest 100 hPa); potential for evaporative cooling; Shear 15 kts.
MUCIN (shaded, J kg
-1
), 1000 hPa RH (red, %),
0-3 km wind shear (kts)
Decaying
Sustaining
Geography for reference only: Star center point for feature based composites.
Sustaining
: MUCIN 35 J kg
-1
with a weak offshore gradient; RH 77%; less of a chance for evaporative cooling; shear 25 kts.
70
70
80
80Slide7
900:800 frontogenesis (10
-2
K (100 km)
-1
(3 hr)
-1
),
900 tmp (black,
o
C), 900 tmp adv (10
-5
o
C s
-1
), 900 winds (kts)
Decaying: QLCS on the warm side of a fronotogenesis maximum; strengthening baroclinic zone/front.
Decaying
Sustaining
Geography for reference only: Star center point for feature based composites.
Sustaining
: QLCS within a region of WAA with little frontogenesis.Slide8
Motivational Questions
What is the role of warm air advection during sustaining events?
What is the role of the
stable layer
and convective inhibition?
How is the enhanced
vertical wind shear important to the maintenance of a QLCS?
What role does low-level
diabatic cooling
play in the evolution of QLCSs? Slide9
2 km
500 m
2 Case Studies
Better understand the processes that govern the maintenance and decay of a QLCS
Simulations
: WRF ARW core
Initial & Boundary Conditions: 32-km NARR
Explicit convection
Morrison double-moment microphysics
MYNN2.5 PBL
Thermal LSM
2002 Decaying
:
23 JUL 0600 UTC –
24 JUL 0300 UTC
2002 Sustaining
:
31 MAY 1200 UTC –
01 JUN 0600 UTCSlide10
31 May 2002
Sustaining Event
0100 UTC 01 JUN 2002 Slide11
NARR: 300 wnd (shaded, m s
-1
), 500 hght (solid, dam), 500 Q-vect conv (dashed, 10
-15
K m
-2
s-1), 500 wnd (m s-1)
2100 UTC 31 May 2002
300 hPa jet extending into base of an upper level trough
500 hPa trough axis over eastern NY
500 hPa Q-vector convergence over the Northeast coastal region
Cold front and prefrontal trough
Cold front & prefrontal trough
Convection ahead of cold front, consistent with composites.
Thermal ridge in the Appalachian lee
Coastal baroclinic zone
Relatively moist air along coast (dew points 17-18
o
C)
2km WRF: mslp (solid, hPa), 2 m tmp (dashed,
oC), 2 m dwpt (shaded, oC), 10 m winds (m s-1) Slide12
1500 UTC 31 May 2002
2100 UTC 31 May 2002
2km WRF: MUCAPE (J kg
-1
), 925 hPa hght (solid, dam), 925 tmc (dashed,
o
C), 925 wnd( m s
-1
)
900 hPa
900 hPa
700 hPa
700 hPa
500 m JFK: 1500 UTC 31 May
500 m JFK: 2100 UTC 1 Jun
T
925hPa
~22
o
C
LI CAPE 400-1600 J kg
-1
WAA similar to composites
1600-2000 J kg
-1
CAPE in lee
T
925hPa
~18
o
C
MUCAPE ~200 J kg
-1
MUCIN ~25-75 J kg
-1
MUCAPE ~700 J kg
-1
MUCIN ~25-100J kg
-1Slide13
2258 UTC 31 May 0145 UTC 1 Jun 0200 UTC 1 Jun
2215 UTC 31 May 0300 UTC 1 Jun 0145 UTC 1 Jun
2 km WRF precip mixr (shaded, g kg
-1
), 100 m omega (contour, 10
-2
m s
-1
), 100 m wnds
Observed radar reflectivity (dBZ)Slide14
23 July 2002 Decaying Event
2200 UTC 23 JUL 2002 Slide15
NARR: 300 wnd (shaded, m s
-1
), 500 hght (solid, dam), 500 Q-vect conv (dashed, 10
-15
K m
-2
s
-1
), 500 wnd (m s
-1
)
2100 UTC 23 July 2002
300 hPa jet core U.S.-Canada border
Broad 500 hPa trough
Little 500 hPa Q-vector convergence over coastal region
Limited mid- and upper-level forcing
2km WRF: mslp (solid, hPa), 2 m tmp (dashed,
oC), 2 m dwpt (shaded,
oC), 10 m winds (m s-1)
Convection collocated with surface cold front, consistent with compositesSlide16
1800 UTC 23 Jul 2002
2100 UTC 23 Jul 2002
500 m JFK: 1800 UTC
500 m JFK: 2100 UTC
700 hPa
700 hPa
900 hPa
900 hPa
Still 1200-1600 J kg
-1
instability along coast and offshore
Little temperature advection similar to composites
1600-2000 J kg
-1
MUCAPE over coast
Inversion becoming reestablished
2km WRF: MUCAPE (J kg
-1
), 925 hPa hght (solid, dam), 925 tmc (dashed,
o
C), 925 wnd( m s
-1
)
MUCIN ~25-150 J kg
-1
MUCIN ~25-150 J kg
-1Slide17
Observed radar reflectivity (dBZ)
2015 UTC 23 Jul 2115 UTC 23 Jul 0000 UTC 24 Jul
2016 UTC 23 Jul 2115 UTC 23 Jul 0005 UTC 24 Jul
2 km WRF precip mixr (shaded, g kg
-1
), 100 m omega (contour, 10
-2
m s
-1
), 100 m wndsSlide18
Low-level Balance Theory for Long Lived Squall Lines
(Weisman & Rotunno 2004)
vorticity generated by ambient low-level shear in along line direction
vorticity generated by buoyancy gradients along leading edge
of the cold pool
=
(Rotunno et al. 1988)
QLCS experiences variations in low-level winds and thermodynamics Slide19
Low-level Balance Theory for Long Lived Squall Lines
(Weisman & Rotunno 2004)
vorticity generated by ambient low-level shear in along line direction
vorticity generated by buoyancy gradients along leading edge
of the cold pool
=
(Rotunno et al. 1988)
QLCS experiences variations in low-level winds and thermodynamics Slide20
Low-level Balance Theory for Long Lived Squall Lines
(Weisman & Rotunno 2004)
vorticity generated by ambient low-level shear in along line direction
vorticity generated by buoyancy gradients along leading edge
of the cold pool
=
(Rotunno et al. 1988)
QLCS experiences variations in low-level winds and thermodynamics Slide21
500 m
0030 UTC 1 JUN (12.5h)
2130 UTC 23 JUL (15.5h)
500 m
precip mixr (shaded, g kg
-1
), potential temp (solid, K), storm relative circulation vectors
C
C
θ’ = 3.75 K
h
c
= 1.2 km
C = 19.3 m s
-1
ΔU
2.5km
= 15.0 m s
-1
θ’ = 4 K
h
c
= 1.3 km
C = 18.3 m s
-1
ΔU
2.5km
= 7.5 m s
-1
C/ΔU=1.3
C/ΔU=2.5Slide22
0100 UTC 1 JUN (13h)
2230 UTC 23 JUL (16.5h)
500 m
500 m
precip mixr (shaded, g kg
-1
), potential temp (solid, K), storm relative circulation vectorsSlide23
Response of QLCS to Low Level (Nocturnal) Cooling
(Parker 2008)
Surface-based phase:
Lifting by the surface cold pool.
Stalling phase:
Mechanism for surface lifting disappears as the relative strength of the cold pool approaches zero.
Elevated phase:
Convection forced by a bore atop the stable layer.
Limited cooling: t=6h30m
Unimited cooling: t=6h30m
Unimited cooling: t=8h30mSlide24
precip mixr (shaded, g kg
-1
), potential temp (solid, K), storm relative circulation vectors
Sustaining Event
Forcing similar to a bore, though not purely bore driven.
Stronger, deeper (up to 925 hPa; 750 m) temperature inversion (WAA)
Moist Brunt-Vaisala Frequency 0.04 s
-1
Decaying Event
More dominantly forced by a surface based density current.
More shallow inversion (975 hPa; 300 m)
Moist Brunt-Vaisala Frequency 0.36 s
-1Slide25
Sensitivity ExperimentsSlide26
t = 16 h t = 17 h t = 24 h
23 JULY 2002: Decrease
Diabatic
Cooling
At t = 13h, reduced the evaporative cooling to 15% of the original value
Convection more intense and moves over the coastal waters
2 km 15%EVAP
CTRL t=15h
15%EVAP t=17h
θ’
4 K
3 K
h
c
1.5 km
0.9 km
C
13.9 m s
-1
13.2 m s
-1
ΔU
2.5km
4.0 m s
-1
6.0 m s
-1
C/ΔU
3.5
2.2
2km CTRL t=15hSlide27
23 JULY 2002: ‘Remove’ Atlantic Ocean
Ocean replaced with land surface representative of the northeastern U.S. A few stronger convective cores, but decay similar to CTRL
t=16h
CTRL-LAND RH (%) at t=16h
LAND precip mixr (g kg
-1
) and CTRL-LAND
line-perpendicular wind (m s
-1
) at t=16h
t=17h
Drier, warmer, deeper boundary layer in LAND run.
Increase ‘offshore’ CAPE for LAND run.
Increase chance for evaporative cooling.
Reduced vertical wind shear for LAND run.Slide28
Summary
In the mean, QLCSs that decay upon encountering the northeastern U.S. coastline are collocated with frontal boundaries and regions of 900:800 hPa frontogenesis, with little temperature advection over the QLCS.
Events that survive over the ocean waters are associated with warm air advection (destabilize atmosphere and strengthen low level temperature inversion: 31 May 2002 case) with little 900:800 hPa frontogenesis associated with the QLCS.
31 May 2002 event
Stronger vertical wind shear helps to balance the cold pool, extending the longevity of the QLCS.
Forcing transitions from a surface-based cold pool to more of a bore type feature (perhaps due to a stronger stable layer compared to 23 July?).
23 July 2002 event
Reducing the diabatic cooling to 15% of the CTRL simulation extended the longevity of the QLCS.
Shows that diabatic processes can be as important as the marine layer in influencing the evolution of QLCS (though this may not always be the case).Slide29
extra slidesSlide30
2km WRF: mslp (solid, hPa), 2 m tmp (dashed,
o
C), 2 m dwpt (shaded,
o
C), 10 m winds (m s
-1
)
Surface observations, mslp (black, dam), surface temp (blue,
o
C)
2100 UTC 31 May 2002
Cold front and prefrontal trough
Convection ahead of cold front, consistent with composites.
Thermal ridge in Appalachian lee
Coastal baroclinic zone
Relatively moist air along coast
WRF ~1
o
C cooler compared to surface obswithin thermal ridgeWRF and obs same at buoy 44025WRF 0.5o
C too cool at Ambrose Light TowerSlide31
1500 UTC 31 May 2002
2100 UTC 31 May 2002
2km WRF: MUCAPE (J kg
-1
), 925 hPa hght (dam), 925 tmc (
o
C), 925 wnd( m s
-1
)
900 hPa
900 hPa
700 hPa
700 hPa
500 m OKX: 0000 UTC 31 May
KOKX: 0000 UTC 1 Jun
1200 UTC
WRF 2-3
o
C cooler
than obs
T
925hPa
increases ~5
o
C
NARR MUCAPE is ~400 J kg
-1
greater
WAA similar to compositesSlide32
2100 UTC 23 Jul 2002
2km WRF: mslp (solid, hPa), 2 m tmp (dashed,
o
C), 2 m dwpt (shaded,
o
C), 10 m winds (m s
-1
)
Surface observations, mslp (black, dam), surface temp (blue,
o
C)
Convection collocated with surface cold front, consistent with composites
WRF does not capture mesoscale details of surface pressure features
WRF ~2
o
C too warm in cold sector and ~2
o
C too cool in warm sector
WRF 1oC too cool at buoy 44025WRF 100 m winds 2.5 m s-1 too weak at Ambrose Light Tower
H
LSlide33
Let’s compare the evolution of 2 different QLCS events…
31 MAY 2002 1700 UTC –
01 JUN 2002 1000 UTC
23 JUL 2002 1600 UTC –
24 JUL 2002 0400 UTC