
Paul Joyce Grad students Andrzej Wojtowicz Craig Beisel Postdocs Craig Miller Darin Rokyta Principle Investigators Paul Joyce Holly Wichman Collaborators Christina Burch Funding NIHR01 GM07604001 ID: 348503
Download Presentation The PPT/PDF document "Seeking a predictive theory of adaptatio..." is the property of its rightful owner. Permission is granted to download and print the materials on this web site for personal, non-commercial use only, and to display it on your personal computer provided you do not modify the materials and that you retain all copyright notices contained in the materials. By downloading content from our website, you accept the terms of this agreement.


Slide1
Seeking a predictive theory of adaptationPaul JoyceSlide2
Grad studentsAndrzej
Wojtowicz
Craig Beisel
PostdocsCraig MillerDarin Rokyta
Principle InvestigatorsPaul JoyceHolly Wichman
CollaboratorsChristina Burch
FundingNIH-R01 GM076040-01Patterns of Adaptive EvolutionSlide3
Outline
Experimental system
Theory of adaptation
Description of the theory Extensions of the theoryData versus theoryTesting the assumptionsTesting the predictions
Beyond the first stepSlide4
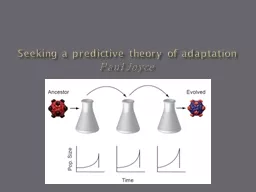
General MethodsEvolved
bacteriophage
ID11 (family Microviridae) on cellular host E. coli C
at elevated temp (37C instead of optimal 33C) for 20 flask passages.Slide5
General Methods
Evolved
bacteriophage ID11 (family Microviridae
) on cellular host E. coli C at elevated temp (37C instead of optimal 33C) for 20 flask passages.
Passage bottleneck size: 104 104 (SMALL) or 10
6 (large)Slide6
General Methods
Evolved
bacteriophage ID11 (family Microviridae
) on cellular host E. coli C at elevated temp (37C instead of optimal 33C) for 20 flask passages.
Passage bottleneck size: 104 104
(SMALL) or 106 (large)Slide7
Flask Passage Design
Wildtype ancestor stock from single plaque
Passage 20
10
4
Transfer Size
10
6
Transfer SizeSlide8
Sampling for each replicate
3
5
10
15
20
Passage:
Plate & pick individual plaques
# plaques picked
16
32
32
32
32
Sequence whole genome of each plaqueSlide9
Sampling for each replicate
3
5
10
15
20
Passage:
Plate & pick individual plaques
# plaques picked
16
32
32
32
32
Sequence whole genome of each plaque
ID Beneficial
mutations
Fitness (growth rate) of each assayedSlide10
Description of the TheorySlide11
Consider the set of all 3L +1 possible genotypes that differ from the wild-type by at most one basepair
AACGTAGCCTATCGA
TTACCGATATCAAACTGCGCGAACAGACCAGTA
AACGTAGCCTATCGAGTACCGATATCAAACTGCGCGAACAGACCAGTA
Fitness
Gillespie’s mutational landscape modelSlide12
If we rank all of the 3L+1 sequences by fitness (fittest has rank 1), then the wild-type will have some rank i, indicating that i - 1 beneficial mutations are accessible.
AACGTAGCCTATCGATTACCGATATCAAACTG
C
GCGAACAGACCAGTAAACGTAGCCTATCGATTACCGATATCAAACTGGGCGAACAGACCAGTA
Fitness
Gillespie’s mutational landscape modelSlide13
If we rank all of the 3L+1 sequences by fitness (fittest has rank 1), then the wild-type will have some rank i, indicating that i - 1 beneficial mutations are accessible.
AACGTAGCCTATCGATTACCGATATCAAACTGCGCGAACAG
A
CCAGTAAACGTAGCCTATCGAGTACCGATATCAAACTGCGCGAACAGGCCAGTA
Fitness
Gillespie’s mutational landscape modelSlide14
The mutational landscape model:Slide15
TESTING THE THEORYTesting the assumptionsSlide16
Testing the assumptions of the mutational landscape model:The Challenges
Identifying the appropriate alternative model
The inability to identify adaptive mutations of small effect
Low statistical power due to small number of beneficial mutations in each experimentSlide17
Testing the assumptions of the mutational landscape model:The Challenges
Identifying the appropriate alternative model
The inability to identify adaptive mutations of small effect
Low statistical power due to small number of beneficial mutations in each experimentSlide18
Extreme Value Theory has three types of tail distributions
Beisel et. al.
Genetics
176: 2441–2449 (2007)
Identifying the appropriate alternative modelSlide19
Generalized Pareto DistributionsSlide20
Testing the assumptions of the mutational landscape model:The Challenges
Identifying the appropriate alternative model
The inability to identify adaptive mutations of small effect
Low statistical power due to small number of beneficial mutations in each experimentSlide21
through are missingSlide22Slide23Slide24
The effects of not shifting
Probability of type I error
Sensitivity AnalysisSlide25
Low statistical powerProblem 3: Low statistical power due to small number of beneficial mutations in each experiment
Solution: Pooling data across experiments.
However, one can distinguish the exponential distribution from the truncated alternatives with relatively few observations.Slide26Slide27Slide28Slide29
Power analysisSlide30
Null = 0; equivalent to the Gumbel (exponential) distributionAlternative model >0 or
< 0
Conclusion: Reject
Gumbel (exponential) distribution in both casesRokyta et al. 2008
Testing the AssumptionsSlide31
Transition
probabilities
Mean Change in rank
Parallel evolution
Mean fitness improvement
Theoretical predictions under exponential distribution
Orr 2002Slide32
Testing the predictions
Orr’s model explains the data poorly
See Rokyta et al. (2005) Nature Genetics 37:441-444Slide33
Testing the predictions
Mutation-adjusted Orr model performs wellSlide34
Extending the TheorySlide35
Exponential Tail
Generalized Pareto Tail
Uniform tail
Transition
probabilities
Mean Change in rank
Parallel evolution
Mean fitness improvement
Joyce, Rokyta, Orr and Beisel (2008)
Theoretical predictions and extensionsSlide36Slide37
Beyond the first stepSlide38
To model adaptation, some common question must 1st be answeredHow often do beneficial mutations arise?
If often, on what background(s) do interfering mutations arise?
Is the fitness landscape smooth or rugged or in between?
From what distribution(s) are beneficial mutations drawn?
Rarely
Rugged
Exponential GPD
Often
Wildtype Most-fit Any
Smooth
ExponentialSlide39
Fitness Landscapes
Rugged
Smooth
Uncorrelated effects
Each fitness iid draws from some distribution Extensive EpistasisAdditive fitness effectsEffects drawn from some distribution
No Epistasis Slide40
ObjectivesUsing data from a virus adapting to lab conditions, we wish to know:
Are properties of a smooth landscape observed?
Are properties of a rugged landscape observed?Slide41
Two well-sampled backgrounds
Wildtype
16 beneficial 1
st
-Step mutations
9 beneficial 2
nd
-Steps on 2534 backgroundSlide42
Is our fitness landscape smooth?Predictions: (a) 1st- and 2nd-steps should be same mutations. (b) Fitness effects should be of similar magnitude.Slide43
Is our fitness landscape smooth?Predictions: (a) 1st- and 2nd-steps should be same mutations.
(b) Fitness effects should be of similar magnitude.
Observations: (a) Only one 1st-step observed among 2nd-steps.
1
st steps
2nd stepsSlide44
Is our fitness landscape smooth?Predictions: (a) 1
st
- and 2nd-steps should be same mutations. (b) Fitness effects should be of similar magnitude.
1
st steps
2nd steps
Observations: (a) Only one 1st-step observed among 2nd-steps.
(b) 2
nd
-steps have lower fitness effects than 1
st
-steps.
1
st
-Steps
2
nd
-StepsSlide45
Is our fitness landscape smooth?Predictions: (a) 1st- and 2nd-steps should be same mutations. (b) Fitness effects should be of similar magnitude.
1
st
steps
2
nd steps
Observations: (a) Only one 1st-step observed among 2nd-steps. (b) 2
nd
-steps have lower fitness effects than 1
st
-steps.
1
st
-Steps
2
nd
-Steps
Conclusion
: Effects are not additive; landscape is not smooth.Slide46
Is our landscape rugged (totally uncorrelated)? Prediction #1
: Mutant 2534 is of high fitness rank (top 3) among observed 1
st-steps.
# of beneficial mutations on 2534 background should be ~ Neg. binomial (0.5, rank=3). Expected # is 3. Is data consistent w/ this expectation?Slide47
Is our landscape rugged (totally uncorrelated)?Prediction #1
: Mutant 2534 is of high fitness rank (top 3) among observed 1
st-steps.
# of beneficial mutations on 2534 background should be ~ Neg. binomial (0.5, rank=3). Expected # is 4. Is data consistent w/ this expectation?
Observation: Observe 9 beneficial mutations—all transitions—on 2534, and estimate (from ‘recapturing’ several) that 18 exist (95% CI: 10-41).Slide48
p = 0.011
Results
:Slide49
Conclusion: Too many beneficial mutations on 2534. Data inconsistent w/ uncorrelated landscape.
p = 0.011
Results
:Slide50
Prediction #2: Mutations on 2534 background should come from upper tail of same distribution as 1st-steps.
2
nd
Test of Uncorrelated LandscapeSlide51
Prediction #2: Mutations on 2534 background should come from upper tail of same distribution as 1st
-steps.
2nd Test of Uncorrelated Landscape
Methods: Fit fitness estimates to:
Single GPD (General Pareto Distribution) = NULLSeparate GPD’s for each background = ALT Bayesian Analysis: Calclulate Bayes’ Odds Ratio of 1 vs. 2 distribution models using MCMC to integrate out uncertainty in fitness & parameters values.Slide52
Results:
1-Distribution
2-Distributions
1st-Steps
2nd-StepsSlide53
Results:
1-Distribution
2-Distributions
1st-Steps
2nd-Steps
Conclusion:
Distribution of fitness effects is not constant between steps. Landscape is not uncorrelated