/
Water Quality Parameters and Measurements Water Quality Parameters and Measurements

Water Quality Parameters and Measurements - PowerPoint Presentation

christina
christina . @christina
Follow
69 views
Uploaded On 2023-09-26

Water Quality Parameters and Measurements - PPT Presentation

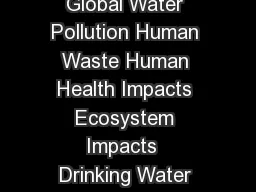
Water Quality Parameters Physical Water Quality Turbidity Total Solids TS and Suspended Solids SS Colour Chemical Water Quality Hydrogen Ion Concentration and pH Total Dissolved Solids ID: 1021388

chemical water solids quality water chemical quality solids wastewater hardness coliform oxygen concentration ion organic total bod nitrogen dissolved

Share:

Link:

Embed:

Download Presentation from below link

Download Presentation The PPT/PDF document "Water Quality Parameters and Measurement..." is the property of its rightful owner. Permission is granted to download and print the materials on this web site for personal, non-commercial use only, and to display it on your personal computer provided you do not modify the materials and that you retain all copyright notices contained in the materials. By downloading content from our website, you accept the terms of this agreement.


Presentation Transcript

1. Water QualityParameters and Measurements

2. Water Quality ParametersPhysical Water Quality Turbidity Total Solids (TS) and Suspended Solids (SS)Colour Chemical Water Quality Hydrogen Ion Concentration and pHTotal Dissolved Solids Alkalinity Hardness Fe and Manganese Etc.

3. Physical Water QualityTotal Solids (TS) and Suspended Solids (SS)Total Solids in water and wastewater include suspended solids (> about 1.0 microns) and dissolved solids (< 0.001 micron in size). (In the LAB Course)Suspended Solids include colloids (0.001 – 1 microns), supra-colloids ( 1 – 100 microns) and settleable solids (> 100 microns). (In the LAB Course)

4. Physical Water QualityTotal Solids (TS) and Suspended Solids (SS)Volatile Solids (volatile SS, VSS and total volatile solids TVS)VS are determined by igniting the residue on evaporation of the filtered solids at 500 o C ± 50 o C for 15 – 20 minutes in an electric muffle furnace. It is used as a measure of the organic content. Settleable Solids Measured by the Imhoff Cone.

5. Physical Water QualityTurbidityTurbidity is a physical characteristic of water that makes water appears cloudy.Turbidity is caused by colloidal materials (e.g. clay, silt, metal oxides, micro-organisms, fibers, oils and soaps)Turbidity measures the clarity of water containing colloidal material that can not be measured by suspended solids measurement, and of water that contains low level of SS. Measured by Turbidimeter (nephelometer)Units: Nephlometric Turbidimeter

6. Physical Water QualityColorTypes True color: caused by dissolved solidsApparent color: caused by suspended solids and includes true color. SourcesNatural Minerals (e.g. iron and manganese brown and tan color)Decay of Organic Matter (e.g. leaves, woods)Colored industrial wastes (e.g. wastes from textile and dying industries). Measurement Visual Comparison with standard platinum-cobalt solution. Colorimeters or spectrophotometers. True Color Unit (TCU).

7. Chemical Water QualityHydrogen Ion Concentration and pHWater (H2O) dissociate slightly to H+ and OH-: H2O ↔ H+ + OH-The Hydrogen ion concentration [H+] for pure water at 25 oC is about 10-7 mol/L (molar concentration), and the hydroxide ion concentration [OH-] is 10-7 mol/L. [H+] + [OH-] = 10-14 pH + pOH = 14

8. Chemical Water QualityHydrogen Ion Concentration and pHpH = - log [H+] = negative logarithm of hydrogen ion concentration. if [H+] = 10-7 then pH= 7 and pOH = 8pH is a measure of the hydrogen ion concentration and is an indicator of the strength of an acid or base. Note: pH does not measure total alkalinity or total acidity of water. The pH scale ranges from 0 to 14 Adding an acid to water causes additional H+ ion to be released so that the H+ ion concentration goes up and the pH value goes down: HCL --------------------> H+ + Cl-

9. Chemical Water Quality Hydrogen Ion Concentration and pHStrong inorganic acids (e.g. HCl, H2SO4) ionize completely in water, and the concentration of H+ then equals the molar concentration of the acid. Weak acids (e.g. Acetic acid, hypochlorous acid) and inorganic acids are poorly ionized in water. Measurement by pH meter with an electrode. Significance of pHImportant in chemical and biological treatment processes of water and wastewater (pH must be controlled within an appropriate range)Important in corrosion control.

10. Chemical Water Quality Total Dissolved Solids (TDS)Dissolved Solids are the solids that can be recovered from water by evaporating the water after filtering the suspended solids (they are less than 0.001 micron in size)Method of Measurement Filtration TDS = TS – SS Conductivity can be used as a rough measure of the concentration of the total dissolved salts (Conductivity Meter), units 1.0 μS/m = 10 μmhos/cm Conductivity of tap water = 70 – 150 μS/m

11. Chemical Water Quality Alkalinity Water alkalinity is a measure of the water ability to resist changes in pH when a strong acid is added (i.e. Ability of water to neutralize acids; buffering capacity of water). Water alkalinity results from the presence of bicarbonate (HCO3-), carbonate (CO3--), and hydroxide (OH-) of elements such as calcium, magnesium, sodium, potassium or ammonia.These compounds originate fromChemical compounds dissolved from rocks and soil, andCO2 from the atmosphere and microbial decomposition of organic matter. CO2 + H2O <--> H2CO3 carbonic acid <--> H+ + HCO3Measured by titration

12. Chemical Water Quality Alkalinity Alkalinity of water either high or low has no ill effects on humans.Highly alkaline waters are unpalatable (bitter taste) CO3= and HCO3- alkalinity complex some heavy metals and thus reduces their toxicityHighly alkaline water often has a high pH and generally contains high levels of dissolved solids (harmful for water to be used in boilers, food processing and municipal water systems). Alkalinity is important for proper chemical treatment of water and wastewater (e.g. Coagulation, softening), and corrosion control.

13. Chemical Water Quality Hardness Hardness is a characteristics of water that prevents that lathering of soap and produces scale in hot water pipes, heaters and other units due to the presence of divalent metallic ions (calcium, magnesium, ferrous ions, manganous ion, and strontium). Hardness in water results from the contact with soil and rocks (limestone) in the presence of CO2Types of hardness Carbonate hardness (temporary hardness): caused by the presence of carbonate and bicarbonate of Ca ++ and Mg++. Ca(HCO3)2  CaCO3 + CO2 + H2O Mg(H CO3)2  Mg(OH)2 + 2 CO2 Non-carbonate hardness (permanent hardness): caused by the presence of chlorides, sulfate and nitrates of calcium, magnesium, and iron.

14. Chemical Water Quality Hardness Calculation MethodThis method is used when complete chemical analyses are available. Hardness (mg/L as caCO3) = Where M++ represents any divalent metallic ion.Example EDTA Titri-meteric Method (In LAB Course)

15. Chemical Water Quality Hardness Classification of Water According to its Hardness. ClassificationHardness Level Soft≤ 50 mg/L CaCO3Moderately Soft50 – 150 mg/L CaCO3Hard150 – 300 mg/L CaCO3Very Hard> 300 mg/L CaCO3

16. Chemical Water Quality Hardness Impact of HardnessMg hardness associated with SO4= has laxative effect on persons unaccustomed to it. Excessive hardness is problematic from the economical point of view (scale formation, high soap consumption)Water Softer than 30 – 50 mg/L as CaCo3 tends to be corrosive.

17. Chemical Water Quality Iron (Fe) and Manganese (Mn)They are present in soil and rocks in insoluble forms (i.e. Ferric oxide, iron sulfide and manganese dioxide). Ground waters that are devoid of dissolved oxygen and high of CO2 content can contain appreciable amounts of fessous ion (Fe++) and manganese ion (Mn++). [Iron ≈ 10 mg/L and Manganese ≈ 2 mg/L]. MeasurementsUsing colorimeters (adding chemical agent to water)Using Atomic Absorption Spectophotometer. Significance of Iron and Manganese Contribute to hardness They are oxidized upon exposure to air causing: metallic taste, staining of clothes and pluming fixture, precipitates in pipes, growth of slime in pipes producing odor and taste problems.

18. Chemical Water Quality Trace Metals Trace metals include those metals that are harmful and toxic in relatively small amounts. The main source of these metals is the discharges of domestic, agricultural, or industrial waste water. Examples of trace metals: arsenic, cadmium, chromium, mercury, lead, silver and barium. Measurement: Atomic adsorption spectophotometer.

19. Chemical Water Quality NitrogenNitrogen compoundsInorganic: Ammonia NH3, Nitrite NO2, Nitrate NO3Organic: Protein, amino acidsMain SourcesDischarge of domestic, agricultural (fertilizers), industrial waste water. Animal wastesDecomposition of dead plants, animal and oragincs by micro-oragnisms Protein  Amino Acid Ammonia Nitrite Nitrate

20. Chemical Water Quality NitrogenSignificance of Nitrogen Compounds Ammonia is very toxic to aquatic life NH3 + H+ <- -> NH4+ Decreasing the pH will shift the reaction to the right (NH4+). Ammonium ions (NH4+) are highly soluble in water but are not toxic. Oxidation of NH3, NO2-, NO3-, and NH4+ by micro-organisms lowers dissolved oxygen concentration in water causing harm to aquatic life. Presence of nitrogen compounds along with phosphorus in water bodies their eutrophication (excessive growth of algae and green plants) which in turn:Lowers dissolved oxygen level in waterChanges color of water Changes taste and odor of waterMakes water bodies unfit for recreational purposes.

21. Chemical Water Quality NitrogenSignificance of Nitrogen Compounds Drinking of water with high nitrate content (NO3-) causes:Blue-baby disease in infants (methemoglobinemia): bacteria in infants’ intestines (less than 6 month old) reduce NO3- to NO2- that oxidizes hemoglobin (containing Fe++) to methemoglobin (containing Fe+++), which is incapable of transporting O2 in the blood stream. This causes a bluish discoloration of infants, and serious health problems and even death. Nitrite (NO2-) can combine with various amines in the gastrointestinial tract to form nitosamines, many of which are known to be carcinogenic. Nitrite is used in cured meat (hotdogs, prepared meats) to retard bacterial growth.

22. Chemical Water Quality Nitrogen MeasurementAmmonia Nitrogen (NH3-N) By titration methodOrganic Nitrogen Digestion then measure NH4+Total Kjeldahl Nitrogen (TKN) = organic nitrogen + ammonia nitrogen Nitrate-Nitrogen and Nitrite-Nitrogen By Colorimetrical method.

23. Chemical Water Quality Organic MatterOrganic compounds are composed mainly of carbon and hydrogen along with other elements such as oxygen, nitrogen, phosphorus, and sulfur. Organics can be classified on the basis of their origin intoNatural organics (e.g. plants and animal tissues, human feces)Synthetic organics (e.g. plastics, rubber)Based on their microbial degradation, organics can be:BiodegradableNon-biodegradable Organics in wastewater Organic s in domestic wastewater include carbohydrates, proteins, fats and oils, and synthetic organics. About 20% to 40% of the organics in sanitary wastewater is non-biodegradable.

24. Chemical Water Quality Organic MatterMeasurement of Organic Concentration in WaterMethods to measure concentrations> 1 mg/LBiochemical oxygen demand, BODChemical oxygen demand, CODTotal organic carbon, TOCMethods to measure concentrations 10-12 to 10-3 mg/LGas chromatograph, GCMass spectroscopy, MS

25. Chemical Water Quality Biochemical Oxygen DemandBOD is the amount of oxygen required (consumed) by microorganisms to biologically degrade organic matter in a water sample under aerobic conditions during a 5-day period at 20 oC. Organics + Microorganisms + O2  CO2 + H2O + new cellsBOD is expressed in mg O2/L of water sample (mg/L).BOD is used to:Measure the organic strength of water/wastewater.Determine the relative oxygen requirements for the biological treatment of wastewater.

26. Chemical Water Quality Biochemical Oxygen Demand The BOD CurveUltimate carbonaceous BOD5-day BOD

27. Chemical Water QualityBiochemical Oxygen DemandThe Shape of BOD curve can be expressed mathematically as: BODt = BOD ultimate (1 – e-tK) BODt = BOD ultimate (1 – 10-tk) BOD5 = BOD ultimate (1 – e-5K) BOD5 = BOD ultimate (1 – 10-5k) Note:K (base e) = 2.303 k (base 10)

28. Chemical Water Quality Biochemical Oxygen DemandThomas Method to Determine k (base 10) Plot values of [t/BODt]1/3 as ordinate (y) against time (t) as abscissa (x).k = 2.61 B/Ak = reaction rate constant, day-1 (base 10)A = intercept of the line on the y-axisB = intercept of the line

29. Chemical Water Quality Biochemical Oxygen DemandRemarks on K (the reaction-rate constant)K determines the speed of the biological reaction. K is function of type of waste, temperature, ability of micro-organisms. Temperature: K value increases with increasing temperature because micro-organisms are move active at higher temperatures KT = K20 Ѳ(T – 20) Ѳ = 1.047Types of waste : simple compunds such as sugar are easily degraded by micro-organisms and have high K values. Complex compounds such as phenols are difficult to degrade and have low K values Example In a BOD determination, 40 mL of wastewater containing 2 mg/L DO, are mixed with 260 mL of dilution water containing 9 mg/L of DO. After 5 days of incubation the DO content of the mixture is 2.74 mg/L. Estimate the BOD5 of the wastewater. Example For the wastewater of the previous example, estimate the oxidation rate of the waste if the ultimate BOD is 100 mg/L. Estimate also the remaining oxygen demand after 5 days.

30. Chemical Water Quality Chemical Oxygen DemandCOD is the amount of oxygen required to chemically oxidize organics in water. MeasurementThe Dichromate Reflux Method. For domestic wastewater, COD>BOD5 because:COD includes both biodegradable and non-biodegradable organics. BOD5 ≠ BODultimate sfsThe BOD/COD ratio varies from 0.4 to 0.8 for raw sanitary wastewater.

31. Chemical Water Quality Total Organic Carbon (TOC)TOC measures the organically bound carbon in the waste. Measurement Using a TOC analyzer.For raw domestic wastewater: BOD ≈ 220 mg/L COD ≈ 500 mg/L TOC ≈ 160mg/L

32. Microbiological Water QualityPathogens: disease causing microorganisms Sanitary wastewater is an ideal environment for microorganisms (MOs) because it is rich in the organic and inorganic nutrients needed for their growth. Most of these MOs are harmless, but sanitary wastewater may also contain pathogens from the excreta of people with infectious diseases that can be transmitted by contaminated water. MOs found in water and wastewater include:Bacteria Protozoa (10 – 300 μm)Algae (single cells to visible branched forms)Fungi (yeasts and mold) Worms (herminths)Viruses ( 20 – 100 nanometers

33. Microbiological Water QualityWaterborne Diseases Diseases transmitted by water are almost of intestine (enteric) origin. Bacterial Diseases Cholera Dysentery Typhoid Gastroenteritis or diarrheal (E-coli)Protozoan Diseases Amebic dysentery Giardiasis Helminthic Diseases BilharziasisAscariasis Hookworm Viral Diseases Infectious hepatitis (type A)Meningitis and heart anomalies Diarrheal

34. Microbiological Water QualityIndicator Organisms for Water Quality Testing water for pathogens is not feasible because:The absence of pathogens does not mean that others are not present. Pathogens present in polluted water are few and therefore are difficult to isolate and identify. Coliform bacteria or coliforms (non-pathogens bacteria) inhibit the intestines in large numbers and always present in faeces together with any pathogens, are used as indicators of faecal contamination. Some genera of the coliform bacteria are not faecal origin but grow and reproduce on organic matter outside the intestines of humans and animals. The term Total Colifom used in laboratory testing referring to all coliform bacteria from faeces, soils or other origin. The term Faecal Coliform refers to coliform bacteria originating from human or animal faeces.

35. Microbiological Water QualityEnumeration of Colifrom The Multiple-Tube Fermentation Technique (the most probable number, MPN)It involves three steps (gas fromation within 48 hr at 35C):The presumptive test: the ability of coliform bacteria to ferment lactose broth The confirmed test: growing cultures of coliforms from presumptive test on a medium that suppresses the growth of other bacteria The completed test:the ability for the coliform growth in the conifrmed test to agin ferment lactose brothThe Membrane Filter Technique (MF)

36. Microbiological Water QualityThe Membrane-Filter Technique:The test steps are:Filter certain amount of water sample (e.g. 100 mL) under vacuum through a membrane filter,.Place the filter in a plastic petri dish containing the growth medium and incubate at 35oC for 24 hours for total coliforms and at 44.5oC for 24 hr for fecal coliforms. [Medium for total coliform: M-Endo, for fecal coliform: M-FC]Count the number of colonies. A typical coliform colony is pink to dark red with green metallic surface sheen. Colifrom density (colony/100 mL) = (coliform colonies counted/mL sample filtered) x 100

37. Microbiological Water QualityNumber of colonies: a range of 20 – 200 colonies is preferred. But for water of good quality (e.g. tap water), disregard the lower limit of 20 colonies. Sample Size: governed by the expected bacterial density. Standard volume for drinking water: 100 mLMain advantages of MF technique over the MPN:The MF enables large volumes of samples to be examined The MF gives a direct count of coliforms rather than an a statistical estimate. The MF is faster than the MPN (within 24 hours).

38. Microbiological Water QualityExample The MF technique was used to test a drinking water for coliform group. 50 mL, 25 mL and 10 mL portions were filtered and the counts were 15, 6, 0 coliform colonies, respectively. Calculate the coliform density. Example The MF technique was used to test polluted water for total coliform. Three different water sample volumes (5 mL, 50 mL, and 500 mL) were filtered through five filter membranes. The colonies counts were as follows: 5 mL portions: 7, 9, 11, 5, 4 50 mL portions: 26, 32, 27, 30, 32 500 ml portions: TNTC (too numerous to conunt) (i.e. > 200 colonies) Calculate the coliform density for this water using the mst valid data.