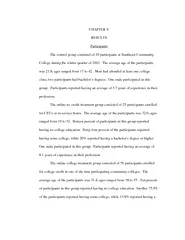
PDF-CHAPTER V RESULTS Participants The control group consi
Author : conchita-marotz | Published Date : 2015-05-20
The average age of the participants was 218 ages ranged from 17 to 42 Most had attended at least one colleg e class two participants had bachelors degrees One male
Presentation Embed Code
Download Presentation
Download Presentation The PPT/PDF document "CHAPTER V RESULTS Participants The contr..." is the property of its rightful owner. Permission is granted to download and print the materials on this website for personal, non-commercial use only, and to display it on your personal computer provided you do not modify the materials and that you retain all copyright notices contained in the materials. By downloading content from our website, you accept the terms of this agreement.
CHAPTER V RESULTS Participants The control group consi: Transcript
Download Rules Of Document
"CHAPTER V RESULTS Participants The control group consi"The content belongs to its owner. You may download and print it for personal use, without modification, and keep all copyright notices. By downloading, you agree to these terms.
Related Documents