/
Global Structure of the Inner Solar Wind and it's Dynamic i Global Structure of the Inner Solar Wind and it's Dynamic i

Global Structure of the Inner Solar Wind and it's Dynamic i - PowerPoint Presentation

conchita-marotz
conchita-marotz . @conchita-marotz
Follow
394 views
Uploaded On 2016-07-23

Global Structure of the Inner Solar Wind and it's Dynamic i - PPT Presentation

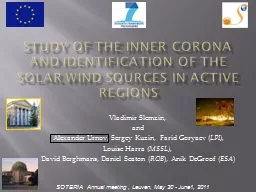
Chashei IV Shishov VI Tyulbashev SA Oreshko VV Subaev SA Radio telescope BSA LPI Big Scanning Array of Lebedev Physical Institute Frequency 111 MHz Bandwidth 25 MHz sampling rate 01 s ID: 416078

ips solar structure level solar ips level structure wind scale averaged 2013 maps activity sources large scintillation strong radio

Share:

Link:

Embed:

Download Presentation from below link

Download Presentation The PPT/PDF document "Global Structure of the Inner Solar Wind..." is the property of its rightful owner. Permission is granted to download and print the materials on this web site for personal, non-commercial use only, and to display it on your personal computer provided you do not modify the materials and that you retain all copyright notices contained in the materials. By downloading content from our website, you accept the terms of this agreement.


Presentation Transcript

Slide1

Global Structure of the Inner Solar Wind and it's Dynamic in the Solar Activity Cycle from IPS Observations with Multi-Beam Radio Telescope BSA LPI

Chashei I.V., Shishov V.I., Tyul’bashev S.A., Oreshko V.V., Subaev S.A. Slide2

Radio telescope BSA LPI (Big Scanning Array of Lebedev Physical Institute)

Frequency 111 MHzBandwidth 2.5 MHz, sampling rate 0.1 s 16 000 dipolesSince 2006 – monitoring regime2006-2011 – 16 beams, 16 analogous receivers, 8o in declination, 24 hours, several hundred scintillating sourcesSince 2013 – 96 beams, 96 digital receivers, 50o in declination, 24 hours, about 5 thousand scintillating sources Slide3
Slide4

Data processing

Scintillation index m2 = <(I-<I>)2

> / <I>

2

depend on density turbulence level at Fresnel scale about 100 km and radio source angular structure

Mass measurements: information on the all individual sources structure is not available. The assumption: the population of radio sources in spatially uniform statistical ensemble: mean parameters of radio sources are equal in equal in equal sky areas.

Initial value is the intensity structure function

D

I

(

,

t

) = <[

I

(

t

+

)

-

I

(

t

)]

2

>

,

on the interval 1 min at the time lag 1 s

D

I

(

=1 s) = 2

(

2

IPP

+

2

noise

)

Typical values

IPP

0

=

0.2

Jy

Scintillation level is characterized by the number of scintillating sources

N

in the sky area 8

o

x8

o

(2007-2011) and 3

o

x3

o

(since 2013). The value of

N

is proportional to the scintillation index squared:

N(

IPP

>

0

)

0

-2

N

<m

2

>Slide5

Sunspot number WSlide6

Monthly averaged scintillation level, February of

2007-2011 Slide7

Monthly averaged scintillation level

in the period of low solar activity 2007-2011Slide8

Comparison of monthly averaged data with sunspot numberSlide9

Solar minimum: conclusion

Convincing evidences of a strong concentration of the turbulent solar wind plasma in the equatorial plane during the very deep solar minimum in 2008 and 2009.This concentration is connected with the influence of heliospheric current sheet. Variations of monthly averaged IPS level are correlated with variations of solar activity. Slide10

Examples of 2D IPS level maps

96 beams, 111 МHzHorizontal axis – 24 hours, vertical axis – 50

о

in declination

,

the pixel scale is

3

о

х 3

о

5-10 sources in the pixel

Red – strong level, yellow – weak level

The Sun is in the center of the strong oval

31.07.2013

12.09.2013Slide11

Sequence of IPS maps

, 12.06 – 18.06.2013, large scale irregularities, strong variability from day to day Slide12

Sequence of IPS maps averaged over week intervals

, 22.05-09.07.2013 , large scale irregularities, variability from week to week Slide13

IPS maps

2013/2014 averaged over month intervals, the 30

о

diameter ring – strong IPS, decrease inside and outside the ring

Slide14

IPS maps

2013 averaged over months and latitudes, as a rule left maximum is higher than right  east-west asymmetrySlide15

Solar maximum: conclusion

The global structure of turbulent solar wind in average is close to spherically symmetric in the period of solar activity maximum. The spherically symmetric structure is seen on the 2D IPS level maps averaged over periods of time exceeding one month. The disturbances with enhanced density turbulence and spatial scales about 0.3 AU are permanently observed on the symmetric background. The global slowly varying structure is masked by large scale disturbances on the daily 2D IPS level maps. The IPS data show the presence of the spiral-like large scale structures in the solar wind. The spiral-like structures may be connected with the large scale region of interaction between solar wind streams with different speeds or with the anisotropy of small scale irregularities in the ambient spiral interplanetary magnetic field. Further studies are needed for choosing between two possible explanations.

The solar wind large scale structure is highly variable at all observable temporal scales: days, weeks, months etc. Slide16

Example of the CME observation: sequence of IPS maps in the period 28.09

— 02.10.2013: propagating disturbance; solar flare of С class on 30.09 at 00 UT;

magnetic storm

Dst

= -67

nT

at

08 UT

02.10

28.09.13

29.09.13

30.09.13

01.10.13

02.10.13Slide17

Conclusion

Main contribution in IPS level at the meter waveband is produced by low latitude region near the Earth orbit during low solar activity. One can expect that the influence of this region is comparatively lower at higher frequencies, such as 327 MHz (Ooty and STEL).Spatial distribution of IPS level in average is close to spherically symmetric in the period of high solar activity.Dynamics of the global IPS structure in the solar activity cycle is similar to the dynamics of the mean solar wind flow, that means similarity between absolute level of density turbulence at 100 km scales and the mean plasma density.Solar wind plasma is irregular and highly variable. IPS monitoring is effective tool for study of the solar wind dynamics at different temporal and spatial scales.