/
Illinois Lake Michigan ( Illinois Lake Michigan (

Illinois Lake Michigan ( - PowerPoint Presentation

conchita-marotz
conchita-marotz . @conchita-marotz
Follow
346 views
Uploaded On 2019-06-27

Illinois Lake Michigan ( - PPT Presentation

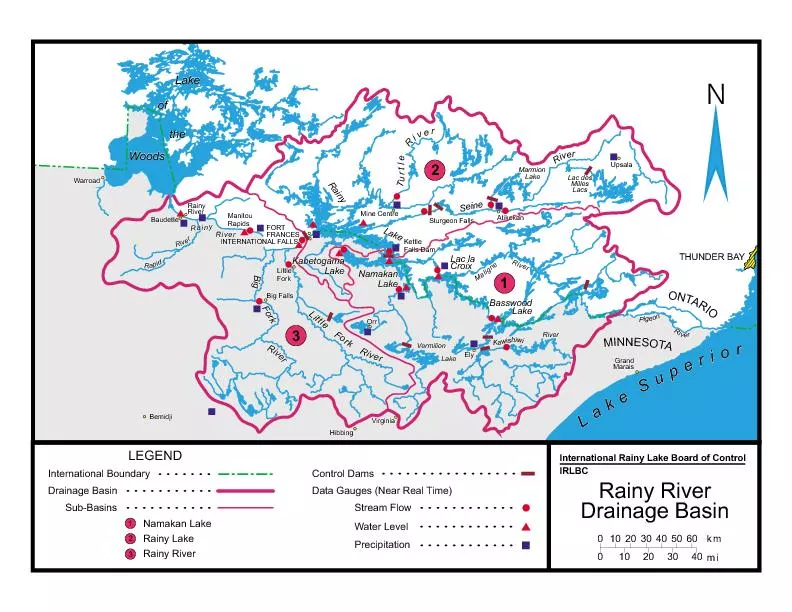
nearshore Mercury and PCB TMDLs Public Meeting May 2015 Outline Project study area Overview of mercury and PCB impairments Overview of TMDL Scoping Report Receive comments on the Scoping Report ID: 760410

fish water model mercury water fish mercury model tmdl loads data concentration quality pcb pollutant selection approach level pcbs

Share:

Link:

Embed:

Download Presentation from below link

Download Presentation The PPT/PDF document "Illinois Lake Michigan (" is the property of its rightful owner. Permission is granted to download and print the materials on this web site for personal, non-commercial use only, and to display it on your personal computer provided you do not modify the materials and that you retain all copyright notices contained in the materials. By downloading content from our website, you accept the terms of this agreement.


Presentation Transcript

Slide1

Illinois Lake Michigan (

nearshore) Mercury and PCB TMDLs

Public Meeting

May 2015

Slide2

Outline

Project study area

Overview of mercury and PCB impairments

Overview of TMDL Scoping Report

Receive comments on the Scoping Report

Slide3

Project study areaWaters to be addressed

IEPA has identified 56 Lake Michigan nearshore segments that are impaired due to PCBs and mercury.

51 beach/shoreline segments

4 harbors1 nearshore open water segment

Slide4

Study Area Harbors

North Point Marina

Waukegan Harbor North

Diversey

Harbor

Calumet Harbor

Slide5

Outline

Project

study area

Overview of mercury and PCB impairments

Overview of TMDL Scoping Report

Receive comments on the Scoping

Report

Slide6

Mercury ImpairmentsWhat is Mercury?

Naturally occurring elemental chemicalChemical symbol HgHeavy metal Many industrial usesBatteriesPaint (historical)LightingSwitches ThermometersDental

Slide7

Mercury ImpairmentsEnvironmental Effects

Causes adverse health effectsImpaired neurological developmentPrimary concern is methyl-mercury in fishMethyl mercury concentrations in water can bioaccumulate 1,000,000 times in fish

Consumption of contaminated fish is a significant human health and wildlife concern

Slide8

Driscoll, C.T., D. Evers, K.F. Lambert, N. Kamman, T. Holsen, Y-J. Han, C. Chen, W. Goodale, T. Butler, T. Clair, and R. Munson. Mercury Matters: Linking Mercury Science with Public Policy in the Northeastern United States. Hubbard Brook Research Foundation. 2007. Science Links Publication. Vol. 1, no. 3

.

Mercury Impairments

Caused Primarily by Atmospheric Deposition

Slide9

Aquatic Life Use ImpairmentBased on the most recent 3 years of water quality data.At least two exceedances of the acute numeric standard within the most current 3-year period.>10% of samples are less than or equal to the chronic standard, and the mean is less than or equal to the chronic standard.Fish Consumption Use ImpairmentWaterbody-specific fish-tissue data collected since 1985.Fish consumption advisories issued by Illinois Fish Contaminant Monitoring Program

Mercury Impairments to Designated Uses

Slide10

Mercury Impairments: Average Concentration by Fish Species

SpeciesCount of SamplesAverage Concentration (mg/kg)Largemouth bass30.280Smallmouth bass70.110Rock bass90.102White sucker40.053Sunfish50.033Black bullhead20.055Rainbow trout20.064Brown trout10.103

Red

values exceed fish consumption target of 0.06 mg/kg

Slide11

PCB ImpairmentsWhat are PCBs?

PCB = polychlorinated biphenylsynthetic, chlorinated organic chemicalsproduced mainly for their insulating capabilities and chemical stabilityBanned from production in 1979 Cause a variety of health effectsimpacts to the nervous, immune, reproductive, and endocrine systemscancer

Slide12

PCB ImpairmentsWhat are PCBs?

Chemical nature of PCBs makes them an environmental issue, even though their production has long been bannedChemical stability makes them long-lasting in the environmentStrong tendency to accumulate in fish tissue

Slide13

PCB Sources

PCBs are a man-made compound, with no natural sourcesPCBs enter Lake Michigan waters primarily from the atmosphere Sources to the atmosphere consist primarily of remnants from past PCB usesCapacitors, transformers, and other electrical equipmentOften accumulated in landfills, scrap yards

Slide14

PCB Impairments to Designated Uses

Fish Consumption Use ImpairmentWaterbody-specific fish-tissue dataA waterbody-specific, “restricted consumption” or “no consumption” fish consumption advisory is in effect

Slide15

PCB Impairments: Average Concentration by Fish Species

SpeciesCount of SamplesAverage Concentration (mg/kg)Carp524.329Lake trout300.811Black bullhead31.027Rock Bass100.276Sunfish70.189Largemouth Bass40.225Bloater70.270White sucker60.237

SpeciesCount of SamplesAverage Concentration (mg/kg)Smallmouth bass70.172Pumpkinseed sunfish30.183Alewife60.187Round goby30.137Yellow perch220.092Brown Trout10.659Rainbow trout20.152Rainbow smelt10.100

Red

values exceed target of 0.06 mg/kg

Slide16

Objectives

Project study area

Overview

of mercury and PCB impairments

Overview of TMDL Scoping Report

Receive comments on the Scoping

Report

Slide17

TMDL Scoping Report

Determine numeric TMDL target for mercury and PCBsSelect a target fish speciesRecommend approach for defining the relationship between pollutant load and concentration in water/fishDevelop a conceptual model and assess data gaps

Slide18

Numeric Targets

Define acceptable water quality

How much mercury and PCBs can we have and not impair the designated uses?

TMDL targets must be expressed at a level to demonstrate attainment of State Water Quality Standards (WQS)

Slide19

Numeric mercury water quality criteria1.3 ng/L for the Wildlife Value3.1 ng/L for Human Health Protection1,700 ng/L for Aquatic Acute Toxicity910 ng/L for Aquatic Chronic Toxicity0.06 mg/kg for Fish ConsumptionBased on 0.10 ug/kg/day Health Protection Value for fish consumption for sensitive populations

Mercury Water Quality Standards

Slide20

Numeric water quality criteria for PCBsWildlife Value of 0.12 ng/LHuman Cancer Value of 0.026 ng/L Fish consumption advisory triggered0.06 mg/kg fish tissueBased on the health protection value of 0.05 ug/kg/day

PCB Water Quality Standards

Slide21

TMDL Targets

Health Protection Value for fish consumption for sensitive populations used to derive TMDL target

0.06 mg/kg for PCBs

0.06 mg/kg for mercury

TMDL target will also need to demonstrate that compliance with the fish tissue TMDL target will also meet the most protective water quality targets.

0.026

n

g/l for PCBs

1.3 ng/l for mercury

Slide22

Target Fish Selection - Characteristics

Many species sampled to assess fish consumption impairment; however, more efficient to evaluate one species to determine reductions needed.

Selected species should possess the following:

Concentrations near the upper bound for all species

Consumable by humans

Sampled abundantly enough so TMDL is not overly influenced by potential sampling variability

Slide23

Target Fish Selection – Available Mercury Data (fish fillets)

Fish

Nearshore open water/shorelineCalumet HarborNorth Point MarinaWaukegan HarborTotal CountLargemouth bass  3 3Smallmouth bass 52 7Brown trout1   1Rock bass 1449Rainbow trout2   2Black bullhead   22White sucker  224Sunfish  325Grand Total36141033

Slide24

Target Fish Recommendations-Mercury

Largemouth BassMost highly contaminated, but only 3 samples existSpatial coverage by largemouth bass (and all species) is inadequate to support segment-specific TMDL reduction calculationsTMDL calculations will require pooling of fish data across sites

Fish

Nearshore open water/

shoreline

Calumet Harbor

North Point Marina

Waukegan Harbor

Total Count

Average Concentration (mg/kg)

Largemouth bass


3


3

0.2800

Smallmouth bass


5

2


7

0.1096

Slide25

Target Fish Selection – Available PCB Data (fish fillets)

FishNearshore open water/ shorelineCalumet HarborDiversey HarborNorth Point MarinaWaukegan HarborTotalAlewife6    6Black bullhead    33Bloater chub7    7Brown trout1    1Carp   124052Lake trout30    30Largemouth bass   314Pumpkinseed sunfish  1 23Rainbow smelt1    1Rainbow trout2    2Rock bass 1 4510Round goby 1 2 3Smallmouth bass 5 2 7Sunfish   437White sucker   246Yellow perch21   122Grand Total68712959164

Slide26

Target Fish Selection – Available PCB Data (fish fillets)

Slide27

Target Fish Recommendations-PCBs

CarpMost highly contaminated and widely sampledNo samples from Diversey Harbor, Calumet Harbor or the Nearshore open water/shorelineMay reflect historic conditionsRock bass and lake trout also candidate species

Fish

Nearshore open water/

shoreline

Calumet Harbor

North Point Marina

Waukegan Harbor

Total Count

Average Concentration (mg/kg)

Carp


12

40

52

4.329

Rock Bass

1

4

5

10

0.276

Lake Trout

30

30

0.811

Slide28

Basic Steps in TMDL Development

Watershed characterizationDefine area of concernAssess extent of contaminationSpecify TMDL “Target”Pollutant concentration that maintains compliance with designated usesDefine relationship between pollutant load and concentration (current)

Focus of the Scoping Report

Define pollutant load that meets target

Slide29

Model

Loads

Concentration

TMDL Development

Relating Loads to Water Quality

TMDLs require an assessment of the relationship between pollutant loads and resulting concentration in the water and/or fish

Typically

conducted using mathematical

models

Slide30

Model

Loads

Concentration

Compliance with

water quality

objectives?

TMDL Development

Relating Loads to Water Quality

The model is used to determine the maximum load that will result

in

compliance

with water quality objectives

Slide31

Model

Loads

Concentration

Compliance with

water quality

objectives?

No

Reduce loads

TMDL Development

Relating Loads to Water Quality

Slide32

Model

Loads

Concentration

Compliance with

water quality

objectives?

Yes

Done

No

Reduce loads

TMDL Development

Relating Loads to Water Quality

Slide33

Relating Loads to Water QualitySelecting a Model

Many different types of models exist

Selection of appropriate model requires consideration of

Temporal scale

Spatial scale

Loading sources considered

Pollutant forms

Environmental compartments considered

Fate & transport processes considered

Slide34

Relating Loads to Water QualitySelecting a Model

Many different types of models exist

Selection of appropriate model requires consideration of

Temporal scale

Does the model consider how concentrations change over time, or does it only answer what will happen in the long run?

Slide35

Relating Loads to Water QualitySelecting a Model

Many different types of models exist

Selection of appropriate model requires consideration of

Spatial scale

Does the model treat the entire study area as one lumped entity, or does it handle each impaired segment individually?

Slide36

Relating Loads to Water QualitySelecting a Model

Many different types of models exist

Selection of appropriate model requires consideration of

Loading sources considered

What are the potential sources of mercury and PCBs to these waters?

Slide37

Relating Loads to Water QualitySelecting a Model

Many different types of models exist

Selection of appropriate model requires consideration of

Pollutant forms

Do we consider individual chemical forms or just total pollutant concentration?

Slide38

TMDL Development Relating Loads to Water Quality

Many different types of models exist

Selection of appropriate model requires consideration of

Environmental compartments considered

Are we predicting concentrations in just the water column, and/or in fish, and/or in bottom sediments?

Slide39

Relating Loads to Water QualitySelecting a Model

Many different types of models exist

Selection of appropriate model requires consideration of

Fate & transport processes considered

How does the model describe what happens to the pollutant once it enters the water body?

Slide40

Relating Loads to Water QualitySelecting a Model

Models of toxic contamination of water and fish can be divided into three frameworks

Level

One: Simple

proportionality approaches

Level

Two: Steady

state mass balance approaches

Level

Three: Time-variable

model of pollutant forms in water column and sediments

Slide41

Selecting a Model1: Simple Proportionality Approaches

Environmental concentration assumed proportional to current loading rate

Key features of level one approach

Unable

to describe how pollutant concentrations will change over

time

Considers entire study area as one lumped area

Assumes

that the load-response relationship for each source is

identical

Only addressed

total pollutant concentrations.

Can

consider all environmental compartments: water column, sediments, and biota.

Do

not explicitly describe fate and transport

processes

Slide42

Selecting a Model2: Steady State Mass Balance Approach

Key features of level two approach

Unable

to describe how pollutant concentrations will change over

time

Capable of describing how concentrations change over space

Can consider different

load-response

relationships

for

different sources

Can

consider different pollutant forms

Can

consider all environmental compartments: water column, sediments, and

biota

Can explicitly

describe fate and transport

processes

Slide43

Selecting a Model3: Time Variable Mass Balance Approach

Key features of level three approach

Can consider

how

pollutant concentrations will change over

time

Capable of describing how concentrations change over space

Can consider different

load-response

relationships

for

different sources

Can

consider different pollutant forms

Can

consider all environmental compartments: water column, sediments, and

biota

Can explicitly

describe fate and transport

processes

Slide44

Selecting a ModelHow Do We Choose Among the Options?

Why not just pick the model that has the most features?

More complex models need more data to support them

Model selection needs to balance:

The management questions that need to be answered

The resources available to support the model

Resources = data, time

Slide45

Selecting a ModelData Gap Assessment

Conducted because model selection needs to consider how much data is available

Review available data, to define what we know (and don’t know)

Slide46

Selecting a ModelData Gap Assessment

Slide47

Selecting a ModelData Gap Assessment

Slide48

Selecting a ModelData Gap Assessment

What we know

Transport of mercury and PCBs into the nearshore from the main body of Lake Michigan is a dominant source

Atmospheric loading

of mercury and PCBs

is

a dominant

source to the main lake

and nearshore

Other loading sources (

stormwater

, treatment plants,

flow reversals

from the Chicago Area

Waterways) are relatively small sources

Slide49

Selecting a ModelData Gap Assessment

What we don’t know

Exactly how small the “other loading sources” are

How PCB and mercury concentrations in fish vary over time or across the impaired segments

The magnitude of specific pollutant fate processes

Slide50

Selecting a ModelConclusions

Not nearly enough data exist to apply Level 3 approach

Would require years of additional data collection

Not

enough

data exist to apply Level

2 approach

Could theoretically be applied by making assumptions regarding the missing data

Sufficient

data exist to apply Level

1

approach

Slide51

Selecting a ModelConclusions

Model selection needs to

balance the

management questions that need to be

answered with the time and data available

Decision boils down to:

Can we get a sufficiently accurate result from a Level One approach now?

or

Do we wait until additional data are collected in order to apply a more rigorous approach?

Slide52

Selecting a ModelConclusions

Decision made easier by the nature of the problem

The dominant loads that need to be controlled will take a long time to control

The level of reduction required to achieve TMDL targets will be substantial

Final decision: Why wait for new data to make decisions that can be made now?

Level One proportionality approach recommended

Slide53

What’s Next?

Respond to comments/input received on the Scoping Report

Final selection of TMDL modeling approach

Refine PCB and mercury loads

Apply TMDL models

Develop TMDL

Public meeting to present draft TMDLs

Slide54

Discussion

Study area is impaired due to mercury and PCBs

Significant reductions needed for mercury and PCBs

Many types of models exist

Model selection needs to balance management questions with the available time and data

Level one proportionality approach recommended for mercury and PCB TMDLs

Slide55

Who to Contact?

Penelope Moskus, LimnoTech

pmoskus@limno.com

734-332-1200

Collin Stedman, Illinois EPA

collin.stedman@illinois.gov

217-782-3362