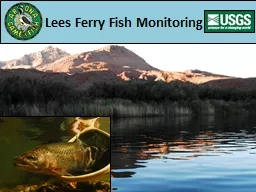
Lees Ferry Monitoring Annual sampling Electrofishing Abundance Size Angler Surveys Catch rates How do Glen Canyon Dam operations influence the rainbow trout fishery Modified low fluctuating flows ID: 280487
Download Presentation The PPT/PDF document "Lees Ferry Fish Monitoring" is the property of its rightful owner. Permission is granted to download and print the materials on this web site for personal, non-commercial use only, and to display it on your personal computer provided you do not modify the materials and that you retain all copyright notices contained in the materials. By downloading content from our website, you accept the terms of this agreement.
Slide1
Lees Ferry Fish MonitoringSlide2
Lees Ferry Monitoring
Annual sampling
Electrofishing
Abundance, Size
Angler Surveys
Catch rates
How do Glen Canyon Dam operations influence the rainbow trout fishery?Slide3
Modified low fluctuating flows
1991-2010
Mean peak discharge = 18,823 ± 2,518
cfs
Mean discharge = 12,816 ± 683
cfsSlide4
1996-HFE
Max-45,600
cfs
Mean-15,235 ± 529
cfsSlide5
2000-LSSF
Max-30,900
cfs
Mean- 8,355 ± 22.4
cfsSlide6
2003-TSFSlide7
2004-TSFSlide8
2004-HFE
Max-41,900
cfs
Mean- 11,789 ± 395
cfsSlide9
2005-TSFSlide10
2008-HFE
Max-42,500
cfs
Mean- 12,830 ± 326
cfsSlide11
2011-EqF
Max-26,200
cfs
2011 Mean- 19,326 ± 380
cfs
May-Aug Mean-24,280 ± 257
cfsSlide12
1991-2010 - 3.1 ± 0.52 fish/min
2011 –
6.9 ± 1.35 fish/min
1996 HFE
2011
EqF
2008HFE
2004 HFE
2003-2005
TSF
2000 LSSFSlide13
Lees Ferry Standardized Monitoring
JuvenilesSlide14
Lees Ferry Standardized Monitoring
306-405 mm
306-405Slide15
Lees Ferry Standardized Monitoring
>405 mmSlide16
2011-EqF
2008-HFESlide17
Rainbow trout <152 mm
2008 HFE
2011 EQSlide18
2008 Cohort
2008 HFE
2011 EQ
Rainbow
trout <152
mmSlide19
Average total length by yearSlide20
Lees Ferry Creel
1991-2011Slide21
Low Angler Catch Rate
High Angler Catch Rate
1.4 fish/hr
0.4 fish/hr
0.6 fish/hr
1.5 fish/hrSlide22
Total Captured
Native Species
Flannelmouth sucker
334
Bluehead
sucker
4
Speckled dace
1
Cold-water Nonnative
Brown trout
43
Brook trout
12
Warm-water
Nonnative
Common carp
180
Walleye
12
Channel catfish
5
Green sunfish
3
Striped bass
2
Smallmouth Bass
2
Red shiner
1
Additional species captured during samplingSlide23Slide24
Native Fish in the
Tailwater to Glen Canyon DamSlide25
Mainstem Fish MonitoringSlide26
Rainbow
troutSlide27
Rainbow
trout
2000-2011
GCDSlide28
Rainbow
trout
2000-2011
GCDSlide29
Rainbow
trout
6-fold decrease in CPUE from RM 58
63
GCDSlide30
Brown
troutSlide31
Brown
trout
2000-2011
GCDSlide32
Common carpSlide33
Common carp
GCD
2000-2011Slide34
Flannelmouth
SuckerSlide35
Flannelmouth
Sucker
GCD
2000-2011Slide36
Bluehead
SuckerSlide37
Bluehead
Sucker
GCDSlide38
Fish Management?
Vision
DFC… Desired Future ConditionsORV… Outstanding and Remarkable ValuesCompromiseDo you want big fish or a lot of fish?
Fish are not the only resource being managed for downstream of GCDFeasibilityFiscal
LegalLogisticalPoliticalSlide39
Fish Management?
Implementation (a few tools)
Add fishTranslocationAugmentationStockingRemove Fish
Mechanical RemovalChemical RemovalChange in regulationsHabitat manipulation
Advantageous or disadvantageous for certain speciesFlowsTemperatureSediment
Food base
Feasibility
Slide40
Fish Management?
Uncertainty/Patience
Adaptive managementUtilize best available information to design experiments to drive resource towards desired conditionExperimentMonitor resource/resourcesAnalyze data and compare current resource/resources to that of desired condition
Go back to step 1 as necessary to reach desired conditions Continue to monitor
FeasibilityPublic OutreachThroughout the process